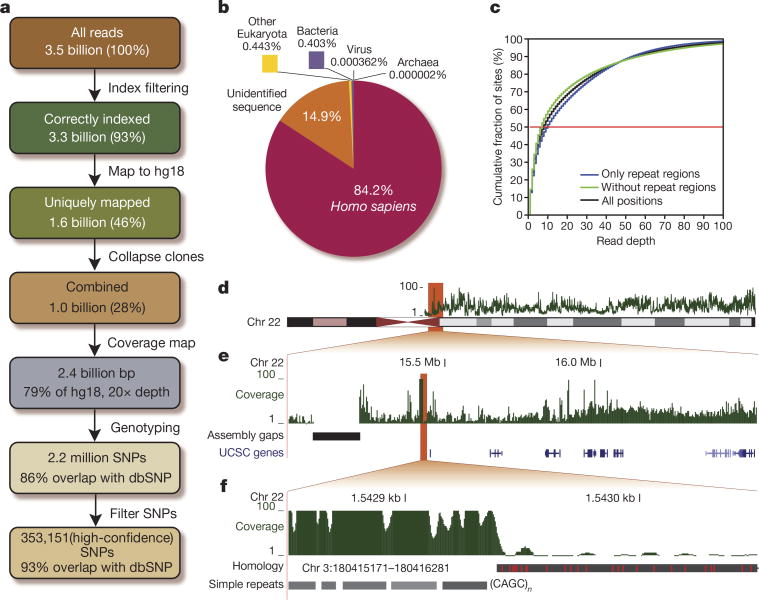
Figure 2. Data summary.
a, Flow diagram summarizing our data pipeline. b, Distribution of all reads among the major taxonomic groups. c, Cumulative distribution of reads across the genome, for all positions (black), only repeat regions (blue) or exclusive repeat regions (green). d, The read depth (green) varies along the chromosomes. e, Much of this variation can be attributed to the repetitive structure of the genome and is especially pronounced in highly repetitive regions, for example, flanking the centromere, but is also observed in regions with genes (shades of blue). f, Simple repeats, here (CAGC)n (grey), are common in assembly gaps and therefore cause alleviated read depths. In contrast, a recent segmental duplication (black, with differences in red) will prevent reads from mapping uniquely and lower the read depth.

