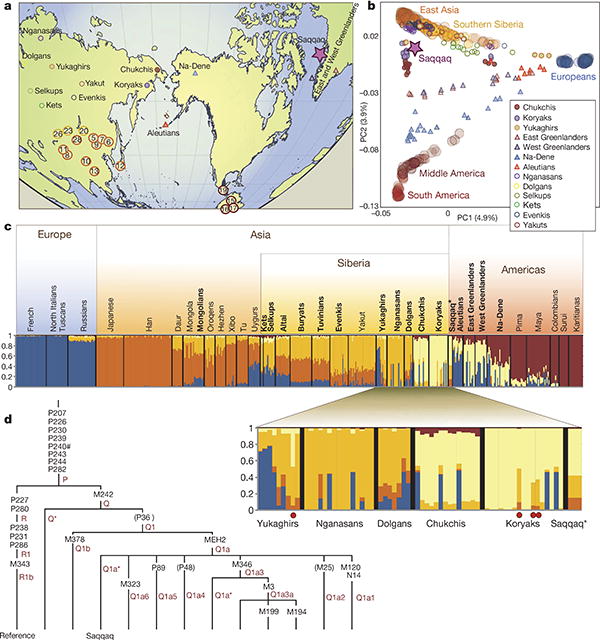
Figure 3. Population genetics and phylogenetics.

a, Locations of the studied populations are shown with the most relevant populations indicated by name (numbers in circles correspond to the nr column in Supplementary Table 12). b, PCA plot (PC1 versus PC2) of the studied populations and the Saqqaq genome. c, Ancestry proportions of the studied 492 individuals from 35 extant American and Eurasian populations and the Saqqaq individual as revealed by the ADMIXTURE program39 with K = 5. Each individual is represented by a stacked column of the five proportions, with fractions indicated on the y axis. The analysis assumes no grouping information. The samples are sorted by region/population only after the analysis. For better readability the Saqqaq individual is shown in three columns. Populations added to the published collection36 are shown in bold. Red dots in the expanded plot indicate four individuals whose ancestry proportion pattern showed the highest correlation (Kendall τ >0.95; P <0.05) with that of the Saqqaq individual. d, The phylogenetic tree of Y chromosome haplogroup Q. The position of the Saqqaq individual is ascertained by markers shown on the tree. Information for markers shown in parentheses is missing and their status is therefore inferred. Haplogroup names are according to ref. 38; hash symbol indicates error in reference (Supplementary information).
