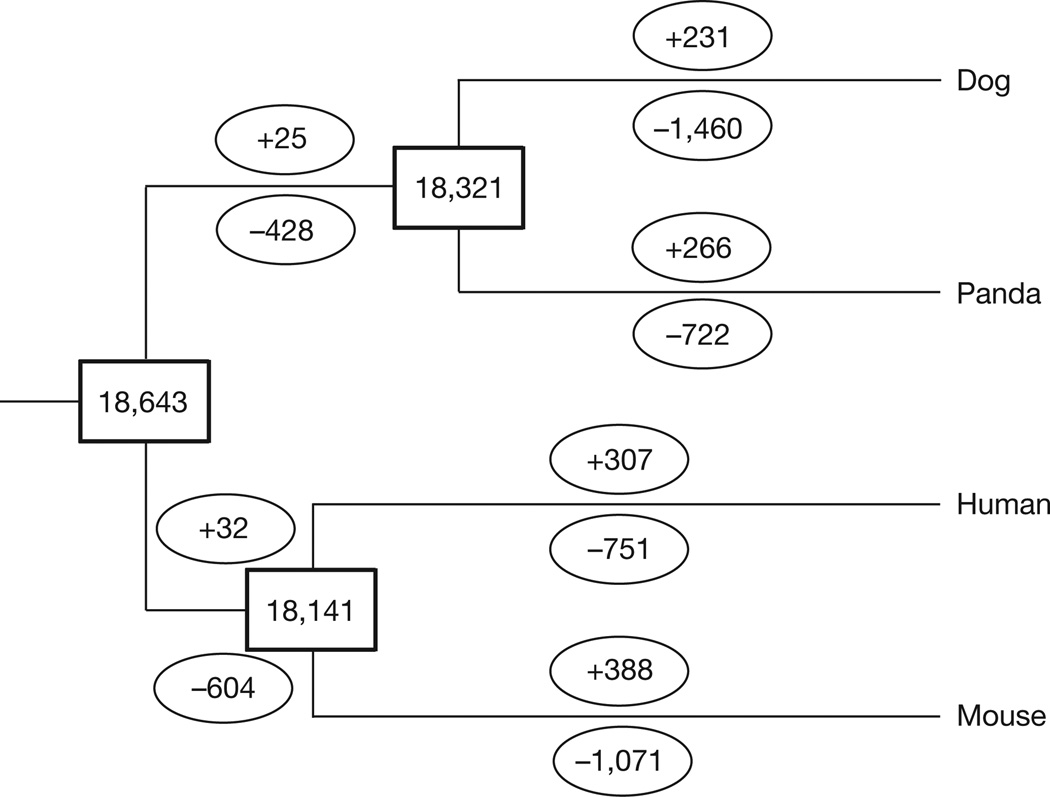
Figure 3. Dynamic evolution of orthologous gene clusters.
The estimated numbers of orthologue groups in the common ancestral species are shown on the internal nodes. The numbers of orthologous groups that expanded or contracted in each lineage after speciation are shown on the corresponding branch, with ‘+’ referring to expansion and ‘−’ referring to contraction.

