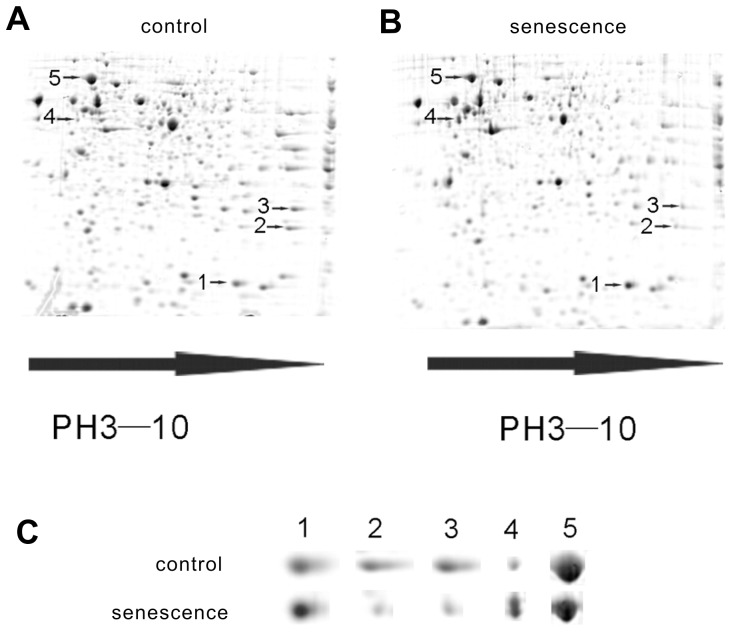
Figure 2. Proteomic analysis of normal and senescent NG108-15 cells.
(A) and (B) Representative 2-DE gel patterns of untreated NG108-15 cells and cells treated with 5 µg/ml cisplatin. The 2-DE patterns of intracellular proteins were visualized using the “blue silver” dye. Each gel, which contained 260 mg of protein, showed more than 400 spots. 3 protein spots (2, 3, and 5, designated by arrow heads) were expressed at higher levels in the untreated cells, and two protein spots (1 and 4, designated by arrow heads) were expressed at higher levels in the cisplatin-treated NG108-15 cells. (C) The 2-DE patterns of the untreated cells (top) and cisplatin-treated NG108-15 cells (bottom). The spot numbers in (C) correspond to those in (A) and (B).

