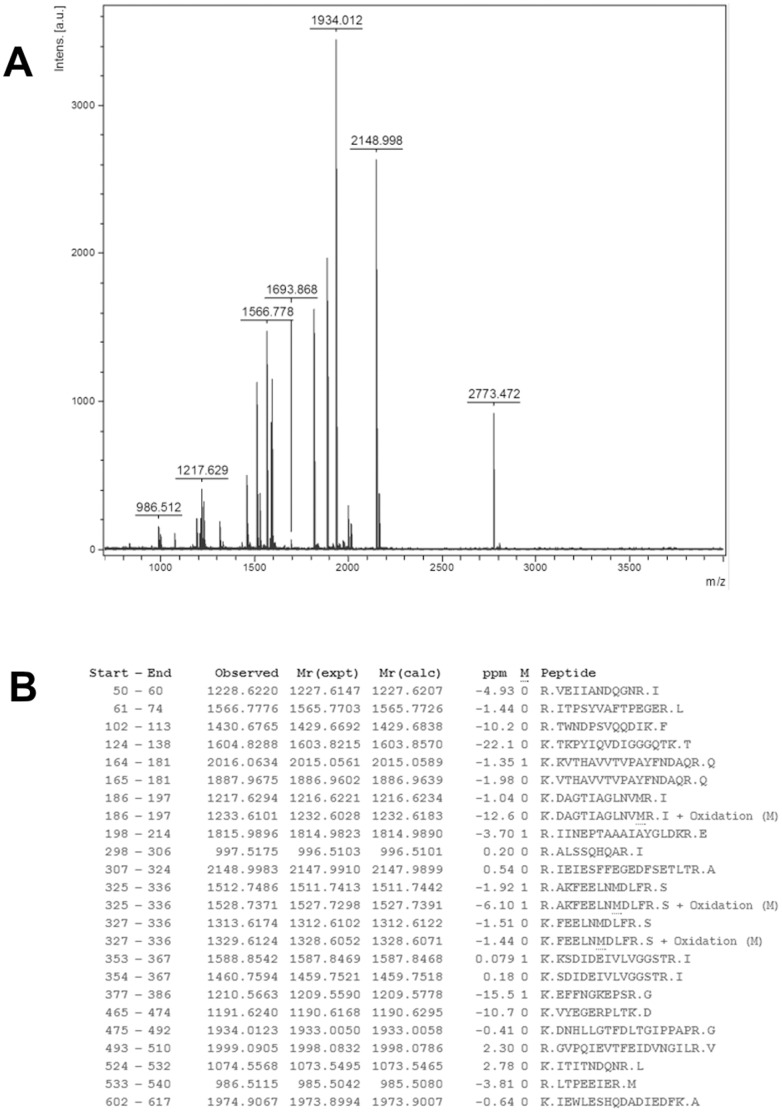
Figure 3. MALDI-TOF mass spectrum analysis of GRP78.
(A) MALDI-TOF mass spectrum obtained from spot 5 after trypsin digestion. The mass spectrum of GRP78, with a precursor ion m/z of 1934.012, is indicated. (B) Peptide sequences from GRP78 matched with the peaks obtained from the mass spectrum. No matches were found for the peaks at 1211.5525, 1464.7470, 1476.5912, 1580.8024, 1592.7943, 1693.8678, 1916.9787, 2163.0147, 2773.4722, and 2807.2904. The data are representative of the results from 3 independent experiments.

