
Figure 5. Fluorescence images of HEK 293 cells show the colocalization of PDI and ERα in cells.
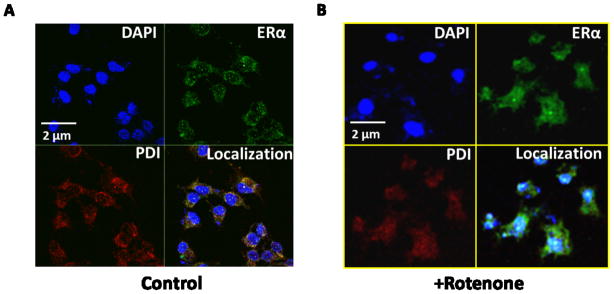
HEK 293 cells were untreated or stressed with rotenone and processed for immunofluorescence as detailed in the Materials and methods section. (A) Colocalization in untreated cell, (B) Colocalization in cells after 400 nM rotenone treatment for 2 hrs. All the cover-glasses were counterstained with DAPI, rhodamine, and FITC to delimitate the nucleolus (in blue color), PDI (in red color), and ERα (in green color) respectively. Images are taken by Zeiss LSM 700 confocal microscopy and analyzed in imajeJ. Representative images are shown from at least 8–10 replicates. The scale bar represents 2 μM.