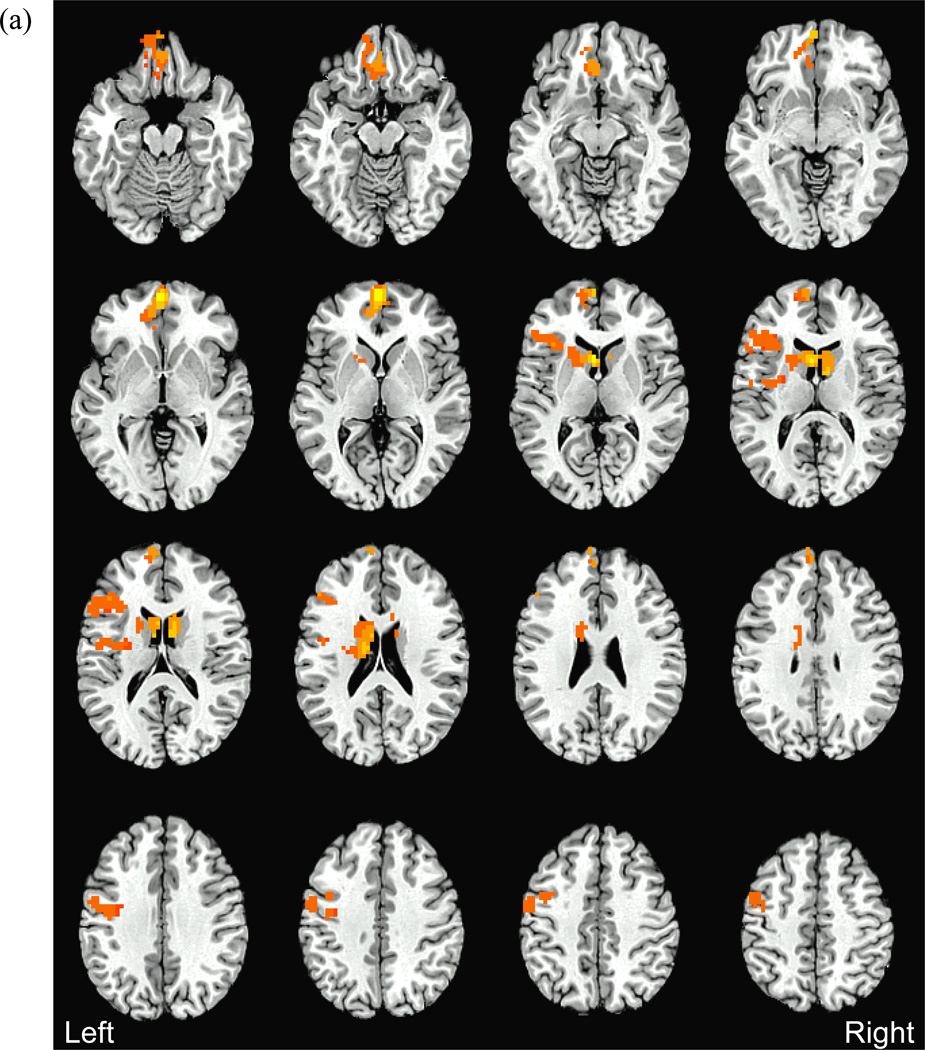
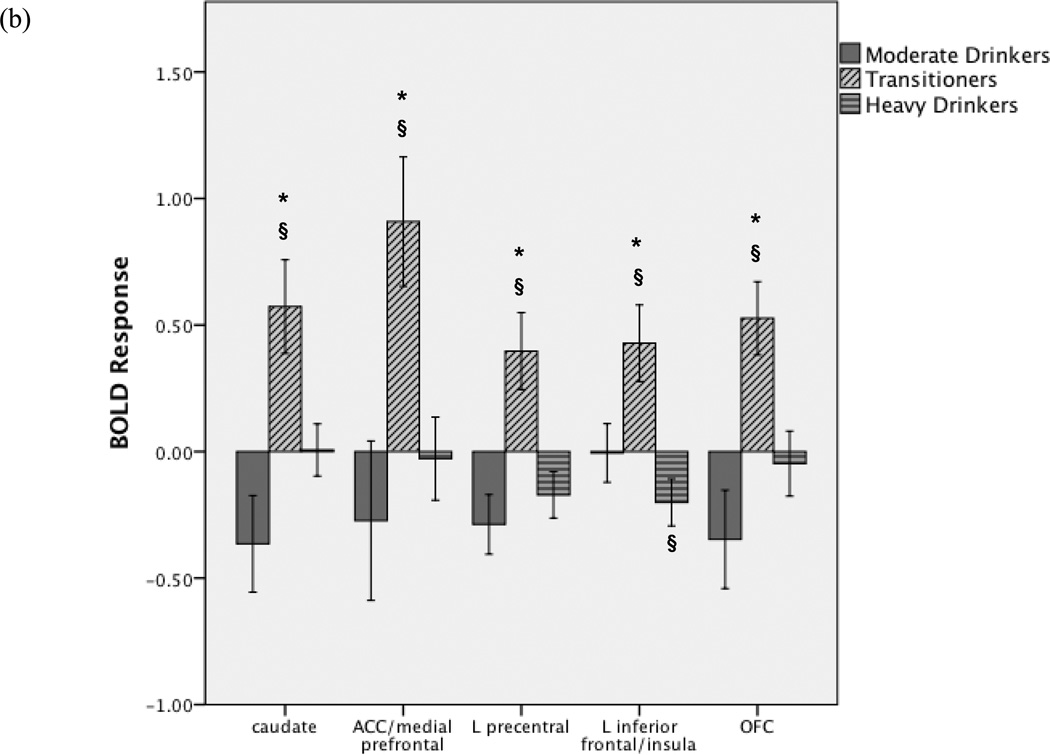
Figure 2.
(a) Between groups differences in BOLD response to alcohol vs. non-alcohol beverage images (clusters>2619µl, 97 voxels, voxel-wise F(2,40)>3.23, p<.05, whole-brain corrected p<.05). Post-hoc analyses revealed that in all clusters, transitioners showed greater response to alcohol vs. non-alcohol beverage images compared to continuously moderate and continuously heavy drinkers (Fig 2b). (b) Average BOLD response to alcohol vs. non-alcohol beverage images within each significant cluster in each group (OFC: orbitofrontal cortex, ACC: anterior cingulate cortex, L: left). Positive BOLD response indicates greater response to alcohol vs. non-alcohol beverage images, negative BOLD response indicates greater response to non-alcohol vs. alcohol images. *For each cluster, Transitioners > Continuously moderate drinkers and Transitioners > Continuously heavy drinkers, p<.05; §Group BOLD response (single sample t-test) significantly different from 0, p<.05. Error bars represent ±1 standard error.


