Figure 4.

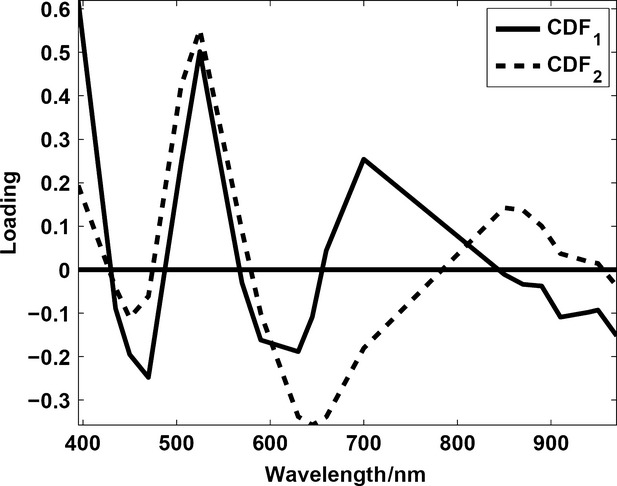
The loadings from the canonical discriminant analysis used to create the browning score. It is clearly seen how the area from 400 to 550 plays a significant role in the transformation vectors.

The loadings from the canonical discriminant analysis used to create the browning score. It is clearly seen how the area from 400 to 550 plays a significant role in the transformation vectors.