
Figure 3.
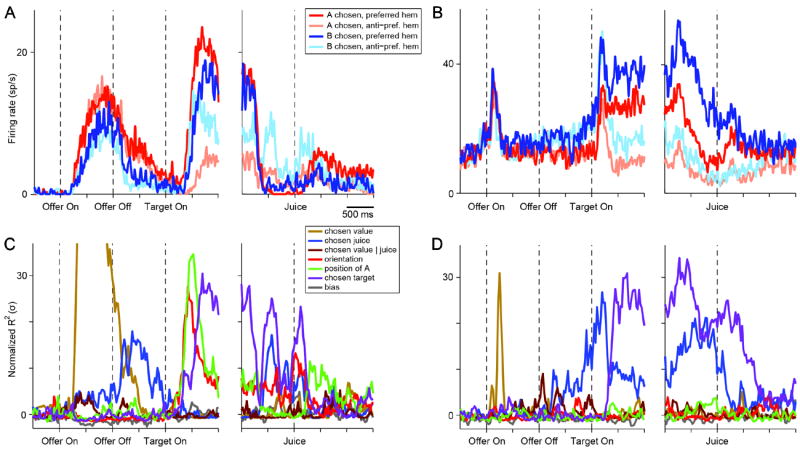
Good-to-action transformation, two cells. (A) Firing rate of one neuron recorded in LPFCv. Trials were divided in 4 groups depending on the chosen juice (A or B) and on whether the saccade was directed towards the cell’s preferred or anti-preferred hemifield (see legend). Immediately before target presentation, the cell activity is modulated by the chosen juice. After target presentation, it gradually comes to also encode the direction of the upcoming saccade (action plan). (B) One neuron recorded in LPFCd. Same format as in (A). (C) Results of the 4-way ANOVA for the cell shown in (A). ANOVA terms were combined in main components (see legend and Table 1). Because different components had different degrees of freedom, the variance explained by each component was normalized (z-scored) compared to a control baseline (see Experimental Procedures). Thus for each component the normalized R2 (y-axis) had at chance level an expected value of 0 and a standard deviation σ = 1. Immediately before target presentation, the choice outcome term chosen juice is the only significant one. The chosen target term, reflecting the action plan, emerges after target presentation. (D) Results of 4-way ANOVA for the cell shown in (B). Same format as in (C). See also Fig.S2.