
Figure 4.
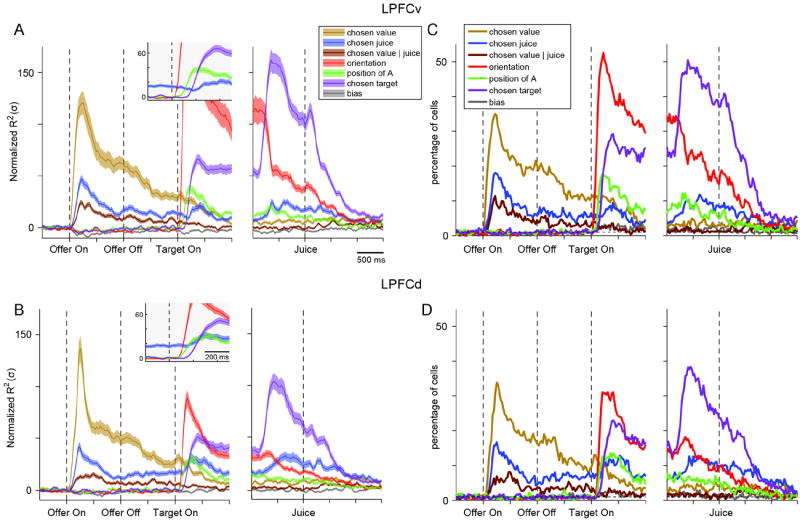
Good-to-action transformation, population analysis. (A) LPFCv (561 cells). The R2 obtained for each component of the 4-way ANOVA was normalized and averaged across the entire population (see Main Text and Experimental Procedures). The normalized mean R2 expressed in units of standard deviation (σ; y-axis), is plotted here as a function of time (x-axis). The insert provides an enlarged view of the window immediately following target presentation (only components relevant to the good-to-action transformation are included). During the delay prior to target presentation, we observed a working memory signal encoding the choice outcome in goods space (chosen juice). After target presentation, two purely visual signals (orientation, position of A) emerged first, followed by the signal representing the upcoming action plan (chosen target). The orientation component (red, off scale) peaked 175 ms after target on at Zorientation = 162 σ. Shaded areas, ± SEM. (B) LPFCd (521 cells). The R2 for each component was normalized and averaged across the entire population. The results are qualitatively similar to those obtained for LPFCv. All conventions as in (A). (C - D) Percentage of neurons encoding different components of the 4-way ANOVA in LPFCv (C) and LPFCd (D). Each panel illustrates the percentage of cells for which each component of the 4-way ANOVA was significant (p<0.01). For components position of A and chosen target, each of which is a combination of two terms, we applied a Bonferroni correction when calculating the percentage of cells (we divided the p value in half). The dotted horizontal line indicates chance level (1%). See also Fig.S3.