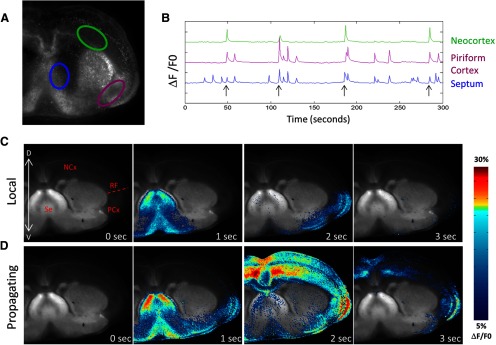
Figure 1.

Local and propagating spontaneous waves in mouse cortex. A, Rhod 3 fluorescence image of a coronal slice of mouse brain at P0. ROIs are indicated in the septal nucleus (blue), the piriform cortex (purple), and the neocortex (green). B, Calcium records of mean fluorescence (ΔF/F0) in each ROI showing both local and propagating waves. Propagating waves are indicated by arrows and can be distinguished from local waves by the presence of signal in the neocortex. y-axis tick marks indicate 10% ΔF/F0. C, Montage of images taken during a local wave. This wave initiates in the septal nucleus and enters the piriform cortex but does not propagate dorsally into the neocortex. Structures labeled in the first frame: NCx, Neocortex; RF, rhinal fissure; PCx, piriform cortex; Se, septal nuclei. D, Montage of images taken during a wave that propagates into the neocortex and, in this case, crosses the midline into the contralateral neocortex. C, D, Images were created by thresholding the calcium signal, applying to it a color map, and then superimposing the colored ΔF/F0 signal onto a grayscale image showing GFP distribution in the slice. See Materials and Methods.
