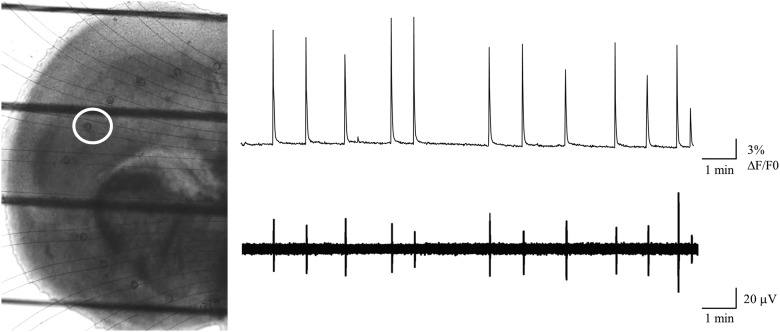
Figure 5.
Simultaneous calcium imaging and extracellular array recording of waves using a microfluidic electrode array. Left, Visible light image of an E17 + 2 DIV (P0) coronal slice placed on the microfluidic recording array. The dark horizontal lines indicate the strings of the harp used to stabilize the slice. The faint curved lines indicate the microfluidic channels connecting the recording apertures to the amplifier connections. The white circle surrounds the aperture from which the electrical recordings illustrated were taken, and was used as the ROI for the calcium imaging record. Right, top, Mean Rhod3 fluorescence from the region indicated. Right, bottom, LFPs recorded at the same time as the Rhod3 fluorescence, from the aperture inside the red region. The 1:1 correspondence between electrical and optical measurements of wave activity.

