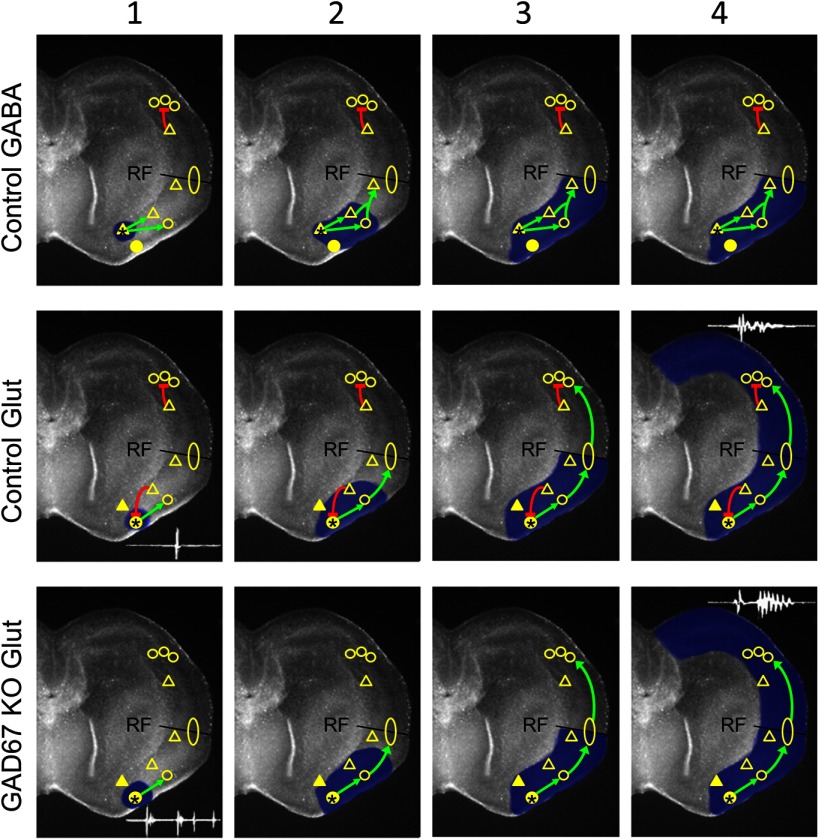
Figure 9.
Circuit model of wave initiation and propagation (see text for full description of model). Yellow circles represent glutamatergic circuitry. Triangles represent GABAergic circuitry. Filled symbols represent initiators. Open symbols represent followers. The yellow ellipse indicates proposed glutamatergic circuitry that spans the rhinal fissure and triggers neocortical waves. RF, Rhinal fissure separating the piriform cortex (below) from the neocortex (above). Green arrows indicate excitation. Red bar lines indicate inhibition. The sequence of initiation and propagation is depicted for GABAergic waves in control slices (top row), glutamatergic waves in control slices (middle row), and glutamatergic waves in GAD67 KO slices (bottom row). Sequence of events proceeds left to right in columns 1–4.

