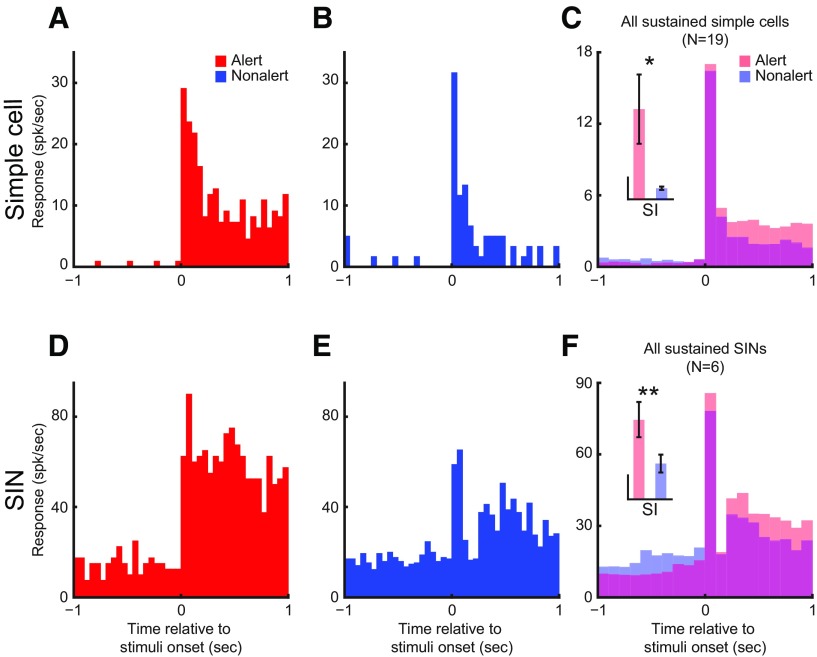
Figure 9.
Both sustained simple cells and sustained SINs have higher sustained response during the alert than during the nonalert state. Each figure plots the cell's response PSTH to optimal flashing stationary stimulus during either state (red, alert; blue, nonalert). A, B, Responses from a sustained simple cell. C, Population average responses of all sustained simple cells (N = 19). D, E, Responses from a sustained SIN. F, Population average responses of all sustained SINs (N = 6). Inset, Comparison of SI between the alert and the nonalert state for each population. Vertical calibration for simple cells, 10; for SINs, 1. Note that the transient component of the response was little affected by state. **p < 0.01; *p < 0.05; paired t test.

