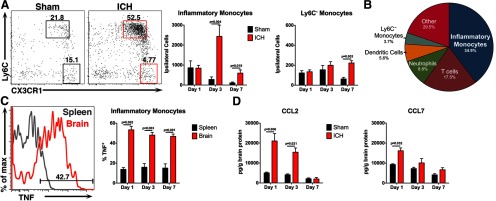
Figure 1.

Inflammation following ICH is characterized by a monocyte-rich cellular infiltrate. Mice were subjected to sham or ICH and their brains were analyzed to characterize the cellular and molecular inflammatory composition. A, Representative flow cytometry plots from day 3 show that inflammatory monocytes (Ly6Chi CX3CR1low) outnumber Ly6C− monocytes (Ly6C− CX3CR1hi) in ICH-treated brains from Cx3cr1GFP/+ mice, whereas both populations are low in number in sham brains. Numbers in the plots indicate the percentage of cells in the plot located in each respective gate. Plots are gated on CD45hi, CD3−, Ly6G−. N = 5–10 mice per group. B, This pie chart shows the mean of each blood-derived cell population in Cx3cr1GFP/+ ICH brains at day 3. Each population was calculated as a percentage of total CD45hi cells in the ipsilateral brain hemisphere. N = 9. C, This representative histogram from WT brain and spleen 3 d after ICH shows inflammatory monocyte TNF staining. Roughly half of the inflammatory monocytes isolated from ICH brains were positive for TNF up to day 7, whereas significantly fewer inflammatory monocytes from spleens stained positive for TNF. N = 5–9 per group. D, By ELISA, the monocyte chemoattractant CCL2 is increased in WT ICH brains up to 3 d after ICH, whereas CCL7 is increased only at day 1. N = 4–6 per group. Error bars indicate SEM.
