Figure 1.
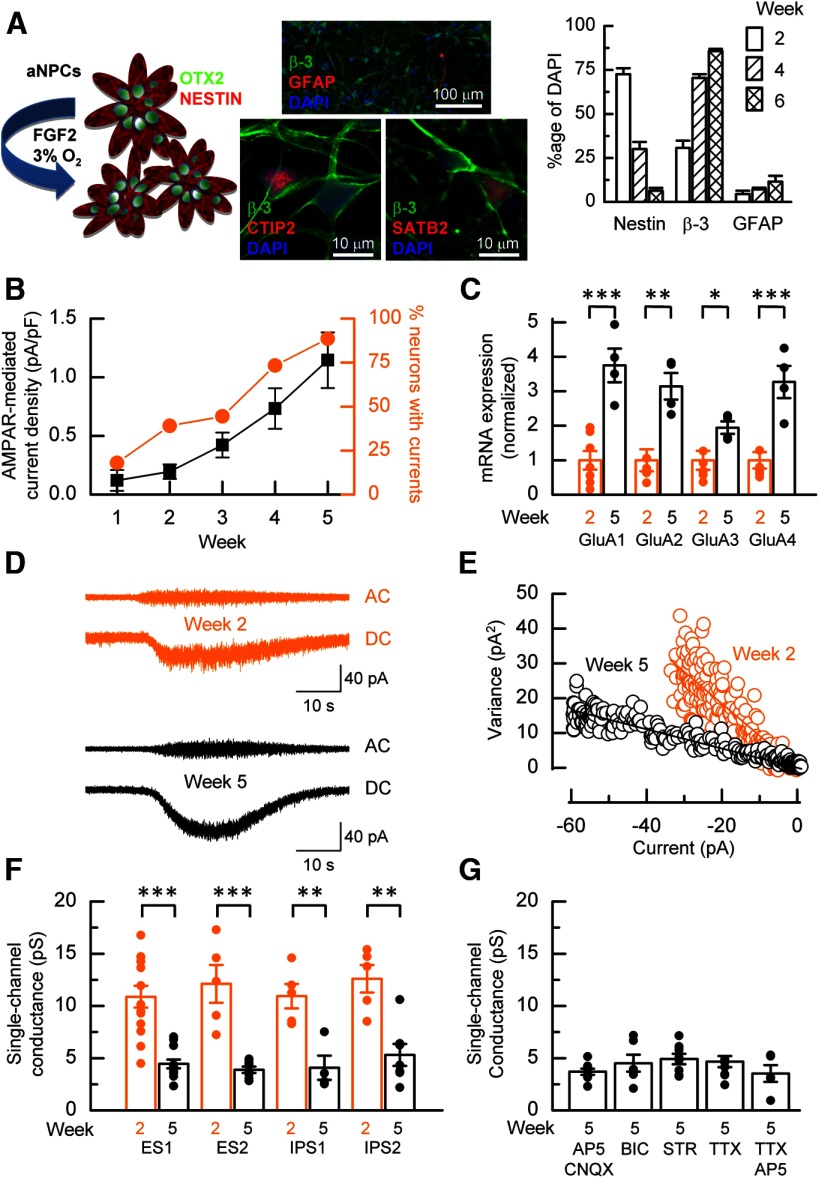
AMPAR maturation. A, Schematic representation of hECNs derived from OTX2+ and Nestin+ aNPCs. Neuronal differentiation is initiated by the removal of FGF2 and cultures are maintained in a 3% O2 atmosphere (Bilican et al., 2014). Immunocytochemistry for neuronal (β3-tubulin) astrocyte (glial fibrillary acidic protein; GFAP) and aNPC (Nestin) markers indicates increasing neuronal differentiation with time in culture and sparse astrocytes throughout. Bar graph displays cell marker counts as a percentage of DAPI-stained nuclei. hECNs are also immunopositive for deep and superficial cortical layer markers CTIP2 and SATB2, respectively. B, Weekly percentage response (orange) to AMPA and the mean AMPA-mediated current density (black). n = 22–35, N > 3. C, Mean normalized mRNA fold expression data for AMPAR subunits GluA1-GluA4 in week 2 and 5 cells as assessed by qRT-PCR. n = 4–6, N = 3, unpaired t test. Relative expression of each subunit of one of the week 2 samples is set to 1 after normalizing to β-actin. D, Example nonstationary fluctuation analysis of AMPAR-mediated whole-cell currents from a week 2 (orange) and 5 (black) neurons. E, Plot of the relationship between the variance of the AC-coupled current and DC-current amplitude for the respective recordings of week 2 (orange) and week 5 neurons (black) shown in D. Linear regression analysis of the relationships for week 2 and 5 data gave respective unitary single-channel current amplitude estimates of −1 pA and −0.3 pA from which the unitary conductance was calculated. F, A decrease in mean conductance is observed in other hPSC lines. n = 4–13, N = 1–3, unpaired t test. G, The switch to lower conductance AMPARs was not prevented by antagonists. n = 5–9, N = 1–2, one-way ANOVA with post hoc Tukey's test.

