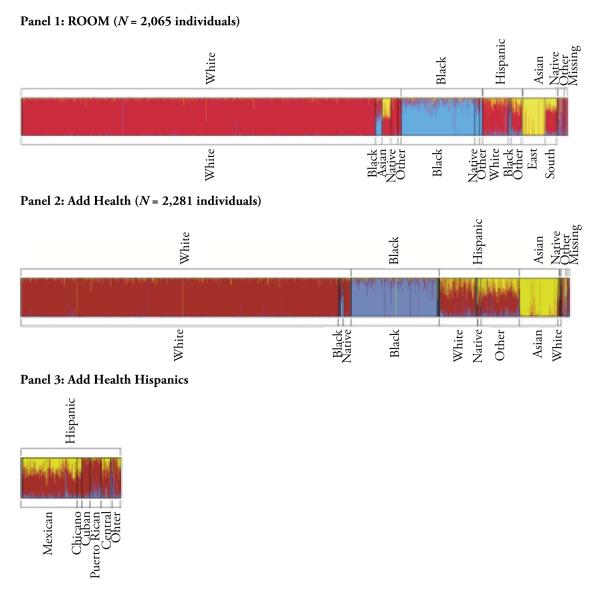
Fig. 1.
The proportional composition in bio-ancestry for each individual based on the STRUCTURE analysis. Each individual is represented by a vertical line partitioned into as many as three segments, with their lengths corresponding to ancestral contribution to an individual’s genome from up to three ancestral populations of Europeans (red), Africans (blue), and East Asians (yellow). The labels of self-reported race/ethnicity were used to order the individuals or vertical lines in the graphs and were added only after each individual’s ancestry had been estimated. There are two sets of labels of self-reports. The set above a graph is based on responses to a question that instructs a respondent to identify with a single race; the set below is based on a question that allows a respondent to identify with more than a single race.

