Abstract
The aim of this paper is to use recent advances in the clinical understanding of the temporal evolution of seizure burden in neonates with hypoxic ischemic encephalopathy to improve the performance of automated detection algorithms. Probabilistic weights are designed from temporal locations of neonatal seizure events relative to time of birth. These weights are obtained by fitting a skew-normal distribution to the temporal seizure density and introduced into the probabilistic framework of the previously developed neonatal seizure detector. The results are validated on the largest available clinical dataset, comprising 816.7 hours. By exploiting these priors, the ROC area is increased by 23% (relative) reaching 96.74%. The number of false detections per hour is decreased from 0.45 to 0.25, while maintaining the correct detection of seizure burden at 70%.
1. Introduction
Hypoxic ischemic encephalopathy (HIE) is the most common cause of seizures in the sick full term neonate. The incidence of neonatal seizures is generally reported as around as between 1-3 per 1000 but may be much higher in very preterm babies [1]. In reality, these values are probably inaccurate estimates as only about one third of all neonatal seizures are clinically visible and many remain undetected in the busy Neonatal Intensive Care Unit (NICU) [2]. Failure to detect seizures and the resulting lack of treatment may result in brain damage and in severe cases, death. A system that could automatically detect and annotate seizures on the neonatal EEG would be extremely useful for clinicians in the NICU. Although a number of methods and algorithms have been proposed previously in an attempt to automatically detect neonatal seizures [3-7], to date their transition to clinical use has been limited due to poor performance. Navakatikyan et al. [5] reported that their system correctly detected 82.8% of the seizure burden (the total amount of time the newborn spends in seizure) at a cost of 2 false detections per hour. A recent study by Cherian et al. [6] reported the correct detection of on average 59% of seizure burden at a cost of 0.58 false detections per hour (FD/h). With the exclusion of the four most difficult and worst performing patients, the number of FD/h was shown to be reduced from 0.58 to 0.28. There are two key directions in automated neonatal seizure detection. The first follows analytical learning principles [8] and focuses on the creation of a set of heuristic rules and thresholds from clinical prior knowledge [3-6]. The resultant detectors analyze EEG using a small number of the descriptors from which a decision is made using empirically derived thresholds. The second approach relies on inductive learning [8] and utilizes statistical classifier based methods [7,9], which employ elements of machine learning to classify a set of features using a data-driven decision rule.
It is known that good solutions to most practical learning problems result from a combination of these two approaches. Unlike analytical rules and thresholds, where binary decisions are obtained, the classifier-based approach often outputs continuous (probabilistic) values and thus provides confidence or credibility to the decisions made. While working in the classifier domain, prior information can easily be introduced using the existing well-defined probabilistic framework.
Domain prior knowledge on neonatal seizures can come in different ways. It can come in terms of statistics of neonatal seizure spatial locations or estimated patient-specific history of previous seizure spatial locations [10]. In the current study, knowledge about the temporal evolution of seizures in neonates with HIE is used to temporally weight the output of a seizure detection algorithm. In particular, the previous work of our group [11] has shown that the distribution of neonatal seizures in time is not uniform. In neurologically compromised neonates, seizures are more or less likely to happen in a certain period after birth. This information is converted in our work into probabilistic weights and integrated into a previously designed system of neonatal seizure detection.
The paper is organized as follows: Section II briefly describes the neonatal seizure detector previously developed by the group. The design of time-varying prior weighting function is given in Section III. Section IV presents the experimental set-up and comparison results. Conclusions are drawn in Section VI.
2. Neonatal seizure detectors
2.1. Dataset
Prompt interpretation of the neonatal EEG provides insight into cerebral function and can help the clinician to diagnose and monitor the treatment of neonatal seizures. [12-14]. Monitoring the EEG over a 72 hour period provides insight into the recovery of cerebral function which is useful for prognosis [15]. The dataset in our work is composed of EEG recordings from 18 newborns recruited from the NICU, Cork University Maternity Hospital, Cork, Ireland. The patients were full term babies ranging in gestational age from 39 to 42 weeks. All newborns had seizures secondary to hypoxic ischemic encephalopathy (HIE). A Carefusion NicOne video EEG monitor was used to record multi-channel EEG at 256Hz using the 10-20 system of electrode placement, modified for neonates. The standard protocol for EEG recording in the NICU required the following 9 active electrodes: T4, T3, O1, O2, F4, F3, C4, C3, and Cz. We used a midline reference electrode in all EEG recordings placed midway between Fz and Cz. Then, the following 8 EEG bipolar pairs were used to annotate the data: F4-C4, C4-O2, F3-C3, C3-O1, T4-C4, C4-Cz, Cz-C3 and C3-T3. Effectively, the bipolar montage is chosen by clinicians at the stage of data annotation. All electrographic seizures were annotated independently by two experienced neonatal electro-encephalographers using simultaneous video EEG. All disagreements in annotations were resolved by consensus. The combined length of the EEG recordings totaled 816.7 hours and contained 1389 electrographic seizures. The dataset contains a wide variety of seizure types including both electrographic-only and electro-clinical seizures of focal, multi-focal and generalized types. Neonates have a very high proportion of electrographic seizures and this proportion increases after anticonvulsant use. It is worth noting that regardless of their origin and irrespective of whether or not a clinical correlation was evident, in the NICU all seizures are deemed equally important. The continuous EEG recordings were not edited to remove the large variety of artifacts and poorly conditioned signals that are commonly encountered in the real-world NICU environment. The seizure dataset used is detailed in table 1.
Table 1. EEG dataset of seizure newborns.
| Patient | Record length (h) | Seizure events | Seizure duration |
||
|---|---|---|---|---|---|
| Mean | Min | Max | |||
| 1 | 29.7 | 17 | 1′30″ | 17″ | 3′54″ |
| 2 | 24.7 | 3 | 6′10″ | 55″ | 11′09″ |
| 3 | 29.9 | 209 | 1′50″ | 11″ | 10′43″ |
| 4 | 47.5 | 84 | 1′38″ | 32″ | 9′58″ |
| 5 | 47.2 | 62 | 6′37′ | 20″ | 34′10″ |
| 6 | 19.2 | 46 | 1′8″ | 15″ | 4′17″ |
| 7 | 60.8 | 99 | 1′32″ | 14″ | 10′20″ |
| 8 | 49.5 | 17 | 5′56″ | 29″ | 19′14″ |
| 9 | 67.7 | 201 | 4′59″ | 13″ | 37′06″ |
| 10 | 59.8 | 41 | 4′51″ | 13″ | 34′46″ |
| 11 | 21.8 | 43 | 2′27″ | 17″ | 7′36″ |
| 12 | 54.4 | 150 | 1′36″ | 15″ | 10′08″ |
| 13 | 51.7 | 60 | 3′26″ | 19″ | 16′56″ |
| 14 | 22.8 | 21 | 8′13″ | 22″ | 39′03″ |
| 15 | 59.7 | 121 | 1′31″ | 10″ | 7′08″ |
| 16 | 76.4 | 190 | 5′03″ | 26″ | 34′37″ |
| 17 | 30.7 | 21 | 5′31″ | 27″ | 23′16″ |
| 18 | 63.0 | 4 | 9′34″ | 7′19″ | 13′22″ |
|
| |||||
| Total | 816.7 | 1389 | |||
The database represents the routine long duration video EEG recordings performed in our NICU. Some recordings contain long periods of missing data. These gaps in recording are caused by competing clinical management requirements and technical difficulties. Limitations in continuous EEG expertise availability result in unattended periods where electrodes may lose contact with the scalp, resulting in long periods of unrecorded EEG. The management of the neonate in the NICU often requires removal of the EEG electrodes to facilitate other clinical investigations such as ultrasound scanning, X-Ray and MRI
2.2. Automated seizure detection system architecture
The neonatal seizure detection system is shown in figure 1. The EEG from the 8 above-mentioned channels was down-sampled from 256Hz to 32Hz with an anti-aliasing filter set at 12.8Hz. It has been shown that frequencies of neonatal EEG seizures range between 0.5 and 13Hz and the dominant frequencies of seizures vary between 0.5 and 6 Hz [31]. The EEG was then split into 8s epochs with 50% overlap between epochs. The most recent recommendations by the International Federation of Clinical Neurophysiology [32] suggest that 5s is the minimum seizure duration if the background EEG is normal and 10s if the background EEG is abnormal. A window length of 8s was chosen given that most babies with HIE and seizures have an abnormal background EEG. This window length would also prevent short duration seizure-like events (e.g. brief intermittent rhythmic discharges) being incorrectly detected as seizure events.
Figure 1. Neonatal seizure detection system diagram.

Fifty-five features were extracted from each channel which represent both time and frequency domain characteristics as well as information theory based parameters. The features are listed in table 2. The results of feature combination, ranking and selection are not presented in this paper, but can be found in our separate study [30]. Several other system architecture choices are detailed in [9, 19].
Table 2. Extracted features.
| Groups | Feature list |
|---|---|
| Frequency domain |
|
| Time domain |
|
| Information theory |
|
Neonatal seizures can be localized to a single EEG channel; thus per-channel annotations are needed to train a classifier. For the seizure class, the training dataset consists of approximately 20 minutes of EEG per patient for which individual channel annotations are available, which sum up to M*20 minutes per patient for seizures involved in M channels. These 20 minutes were selected by a clinical neurophysiologist, with the only criteria being that there had to be clear seizure activity and that they should cover most seizure morphologies and variations. Sections of several independent seizures can contribute to these 20 minutes and indeed the set of the affected channels can vary for each section of seizure activity. For example, if a training dataset consists of 17 patients for which 20 minutes of seizure are transcribed on the per channel basis and on average 4 channels are involved in every seizure, then for an epoch length of 8 seconds with an overlap of 4 seconds, the seizure class of training data will consist of 17patients*(1200s/4s) *4channels = 19200 epochs. It may be more or less depending on the number of channels involved in every seizure for every patient. These were used to represent a seizure class, while 40000 epochs were randomly selected from the non-seizure data for representation of the non-seizure class. In our performance assessment, which is explained later in Section II.C, the number of seizure epochs for training ranged from a minimum of 20227 to a maximum of 25263. The training data for the classifier were normalized anisotropically by subtracting the mean and dividing by standard deviation to assure commensurability of the various features. This normalizing template was then applied to the testing data.
The normalized features extracted from each epoch were then fed to a classifier. The support vector machine (SVM) classifier with a Gaussian kernel K(x, y)=e−γ|x-y|2 was implemented. Nested cross-validation model selection on the training data was performed to choose suitable model parameters. On average, 19% of training data were support vectors. The most frequent pair of selected hyper-parameters was 0.05 for gamma in the Gaussian kernel and 20 for the generalization parameter C. The implementation based on SVMlight software [17] was used. In the testing stage, the testing datapoint from each channel was fed to the obtained classifier:
| (1) |
where M is the number of support vectors, xj is a support vector with a corresponding Lagrangian multiplier αj and label yj. The channel outputs of the SVM were converted to pseudo probabilistic values with a sigmoid function:
| (2) |
where φ(x) is calculated using (1), S denotes seizure, A and B are the parameters of the sigmoid function that are estimated on the training dataset using the method described in [18].
The probabilistic output was then time-wise smoothed with a moving average filter. The maximum of the averaged probabilities across all channels was computed to represent the final support of a seizure. It was then compared to a threshold from the interval [0 1]. After comparison, a binary decision was taken: 1 for seizure and 0 for non-seizure. The ‘collar’ technique was applied last – every seizure decision was extended from either side to account for the delay introduced by the moving average filter and to compensate for possible difficulties in detecting pre-seizure and post-seizure parts. It has been outlined in [9] that the post-processing steps make the system applicable to any number of EEG channels which can be very beneficial in clinical practice. Additionally, the system emits a continuous pseudo-probabilistic output which allows for selection of a desired operating point depending on clinical needs. In [19], the system was shown to outperform the existing alternatives using various metrics and the standardized performance assessment.
2.3. Performance assessment and metrics
In clinical practice, samples of testing patient data are never available beforehand in the NICU. It is therefore necessary to develop a patient-independent neonatal seizure detector. For this reason, the leave-one-out (LOO) cross-validation method was used to assess the performance of the system for patient-independent seizure detection [9]. In this manner, all but one patients’ data from the dataset (table 1) were used for training and development and the remaining seizure patient’s data was used for testing. This procedure was repeated until each seizure patient had been a test subject and the mean result was reported. Several alternatives to the LOO performance assessment for neonatal seizure detection have been discussed in [19]. The LOO method is known to be an almost unbiased estimation of the true generalization error [20]. What is examined with the LOO procedure is not a particular model, but indeed the methodology used to obtain such a model. This last point means that the LOO estimate effectively gives a robust prediction of the performance that other researchers or practitioners will obtain using this method, but trained on their data. Here, eighteen 17 vs. 1 data splits made by the LOO method formed the performance assessment routine.
In each of these 18 times, the data from the 17 training subjects were only partially used for actual training of the primary classifier as only the data with available per-channel annotations were used to represent the seizure class while only 40000 epochs were selected to represent the non-seizure class. The data, which were not exploited for training the classifier, is called the development data in this study. The development data was used to tune other parameters in this work, in particular the parameters of the temporal prior function. This way, the model selection routine is completely independent of the performance assessment routine and the testing subject was not seen or used at any time for any system tuning.
The metrics used in this work are epoch-based sensitivity and specificity values, which are defined as the epoch-wise accuracy of each class (seizure and non-seizure) separately. We also report the event-based number of false detections per hour (FD/h) and Good Detection Rate (GDR). It is worth noting that sensitivity corresponds to the percentage of the correctly detected seizure burden, i.e. the total amount of time the baby spends in seizure. While seizure burden is the most important metric to indicate whether a patient should be treated or not [2], it largely remains unobserved when using conventional event-based GDR and FD/h metrics.
By thresholding the probability of seizure (in the range from 0 to 1), it is possible to report the curves of performance in contrast to reporting a performance for a single operating point. The Receiver Operating Characteristic (ROC) curve, which plots sensitivity over specificity values, is used in this work. The ROC area is related to the Wilcoxon test of significance [21-23]. This relationship can be used to derive statistical properties of the ROC area (θ) such as its standard error (SE) [22]:
| (3) |
where Q1 = θ/(2 – θ) and Q2=2θ2/(1+θ), nA and nN are the numbers of seizure (abnormal) and non-seizure (normal) epochs. To calculate the statistical significance of a difference of two algorithms (ROC areas) evaluated on the same data, we compute the z statistic by taking into account the correlation of the two ROC curves as suggested in [23]:
| (4) |
where θ1 and θ2 refer to the observed areas associated with algorithm 1 and 2, respectively. Here, r represents the estimated correlation between the two ROC curves as outlined in [23]. The resultant p values of the two-tailed test are reported and values less than 0.05 are considered significant.
3. Temporal prior
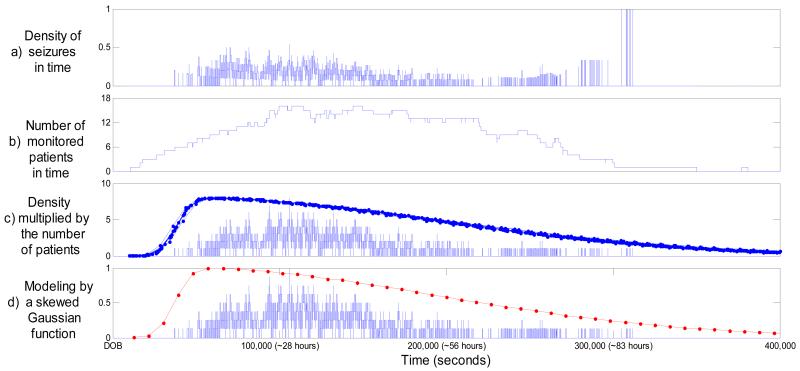
The process of modeling the temporal priors is shown in figure 2. First, the temporal density of seizures was calculated from the dataset as shown in figure 2(a). The x-axis indicates time elapsed after date of birth (DOB). For example, it can be seen from figure 2(a) that at approximately 30 hours after birth around 40% of monitored patients had seizures. It can also be seen that there is a time interval at ~86 hours when the density is equal to 1, which seems to indicate that seizures always happen at this time. Naturally, this data-driven temporal seizure density measure needs to be normalized by some credibility function. Figure 2(b) plots the number of patients monitored versus time. From figure 2(b), it can now be explained that the unit density in figure 2(a) resulted from the fact that only a single patient was monitored at that time. In effect, figure 2(b) shows how credible or reliable the data-driven density is. It is used in our work to weight the data-driven seizure density. It can be also seen from figure 2(b) that there is not a single point in time, relative to the time of birth, where 18 patients from the dataset were all monitored – at most, 16 patients were simultaneously monitored (e.g. ~30h after birth). Figure 2(c) shows the density from plot (a) multiplied by the credibility function from plot (b). It can be seen from figure 2(c) that the resultant measure follows a skewed normal distribution with a long tail. It was decided here to approximate the normalized final measure by a skew-normal distribution. The implementation proposed in [24] is used in our work. Defining , the probability density function of the skew-normal distribution parameterized by location ξ, scale ω, and shape α is given as:
| (4) |
where
| (5) |
| (6) |
Figure 2. Modeling the temporal prior.
The x-axis indicates time elapsed after date of birth (DOB). a) Density of seizures. b) The number of monitored patients. c) Density multiplied by the number of monitored patients and 18 different skew-normal distributions estimated on the development data. d) The most frequent skew-normal distribution fitting the normalized data-driven temporal density.
When shape parameter α=0, the skewness vanishes, and the standard normal density is obtained. As α increases (in absolute value), the skewness of the distribution increases. The sign of α defines whether the distribution is left or right-skewed.
It has been shown in [24] that there is no closed-form expression available for maximum likelihood estimates of the distribution parameters (ξ, ω, and α). Thus, it is not possible to estimate the function by e.g. the Baum-Welch (expectation-maximization) algorithm or gradient-descent. For this reason, the distribution parameters are greedy-searched for each of the 18 splits to provide the best performance over the development data. The resultant 18 functions are shown in figure 2(c). As it can be seen, the function shape of a skewed Gaussian is inherently smooth and thus is insensitive to the exclusion of any one patient’s data.
In order to report a particular parameterized function that can be used by other researchers in future rather than a methodology used to obtain such a function, the most frequently chosen values of the parameter distribution were calculated to be ξ=0.38, ω=1.55, and α=19 (scaled by 105 to fit the actual time axis in seconds). The most frequent function, which is normalized to be between 0 and 1, is shown in figure 2(d) in red.
The 18 modeled prior distribution functions are used to weight the probability of a seizure event given by the classifier in (2). In particular, as shown in figure 1, the maximum probability of seizure computed across channels is multiplied by the corresponding temporal weight.
4. Results and discussion
4.1. ROC area
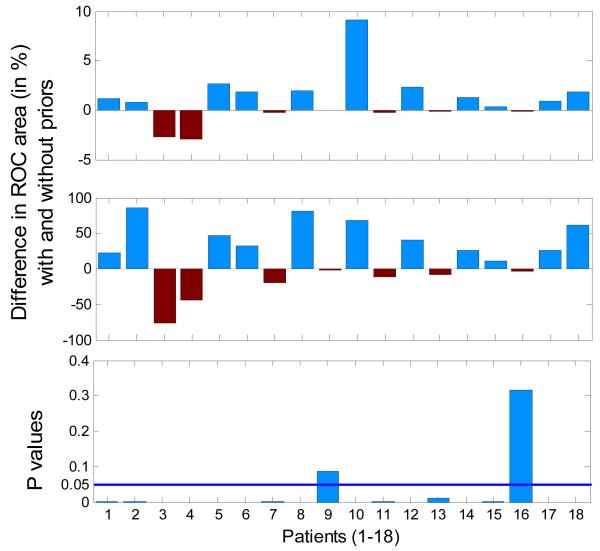
The absolute and the relative differences in per-patient performance with and without temporal priors with their corresponding p-values are shown in figure 3. It can be seen from figure 3 that the separability of seizure and non-seizure probabilistic activity for most patients increases when weighted with the designed prior function. It is worth noting that when the performance approaches 100%, the improvement is better perceived in relative terms which are computed as gained improvement divided by possible improvement. The p-values of the two-tailed statistical significance test of the difference between the two ROC areas indicate that only for patients 9 and 16 the proposed priors have no statistically significant effects. In fact, for these patients the relative differences in performance shown in figure 3 (middle) are the lowest. For the remaining patients, the corresponding p-values are close to 0 and here indicate statistically significant differences for these patients. It is also worth noting that the number of testing datapoints (epochs) in each patient is very large (as can be calculated from table 1). According to (3), the standard error is inversely proportional to the square root of the product of the number of class datapoints. Moreover; the z statistic in (4) depends on the correlation coefficient r in the denominator which here was estimated to be close to 0.96 for each patient. Both factors, the large size of the dataset used and the correlation coefficient close to 1, dictate that even the slightest difference in performance is statistically significant as shown in figure 3.
Figure 3. Absolute (top), relative (middle) per-patient differences in ROC areas and the corresponding p-values (bottom) for the neonatal seizure detector obtained with and without using designed temporal priors.
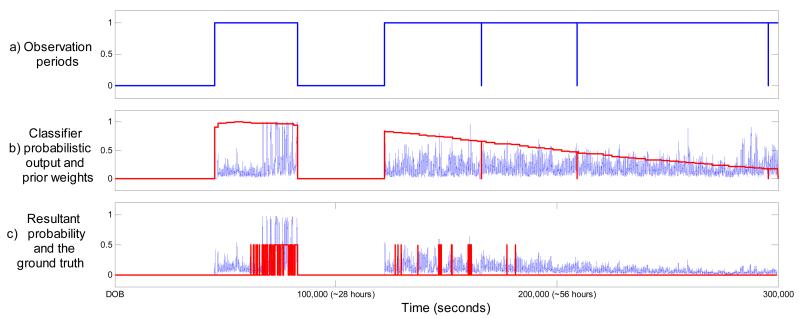
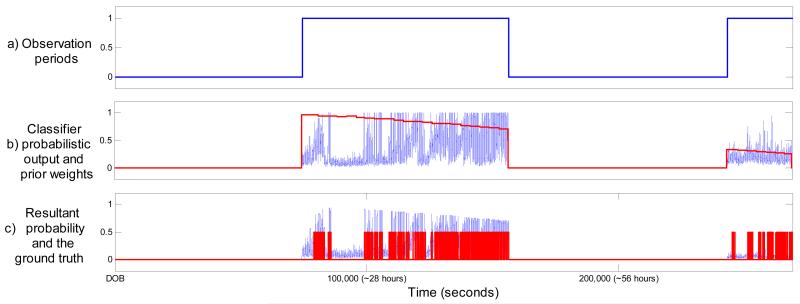
An example of a performance increase for patient 10 can be seen in figure 4. Clearly, the proposed weights managed to emphasize the expected seizure locations and attenuate many later false spikes of probability. The opposite situation can be seen for patients where the application of the weighting function reduces the performance. From an example of patient 3 shown in figure 5 it can be seen that this patient’s temporal evolution of seizure burden does not follow the modeled common distribution. The tail of the weighing function actually attenuates the true classifier probabilistic response to seizure activity. These atypical cases are challenges to the system architect as they are patient-specific and therefore no a priori information is available to account for them. From a statistical point of view, the best one could start with is the patient-independent ‘average’ which is done in this work. On-the-fly adaptation of the ‘average’ is crucial to tackle atypical cases and it is discussed in section 5.2.
Figure 4. Example of patient 10 (ROC increased from 87% to 95.2%).
The x-axis indicates time elapsed after date of birth (DOB). a) Observation periods. b) Classifier output and corresponding prior weights. c) Resultant final probability and the ground truth.
Figure 5. Example of patient 3 (ROC decreased from 96.5% to 94.2%).
The x-axis indicates time elapsed after date of birth (DOB). a) Observation periods. b) Classifier output and corresponding prior weights. c) Resultant final probability and the ground truth.
It can also be concluded that patients with numerous seizures (patient 9 and 16) are those whose performance insignificantly but actually suffered from the application of the designed temporal priors. Clearly, for patients when seizures happen frequently and continuously, any temporal weighting or the pre-emphasis of any temporal location would decrease the performance. Patient 4 has a strong respiration artifact lasting over 3 hours. When emphasized by the temporal weighting function this artifact further decreases the performance. It has been identified in our previous study [9] that approximately 40% of the produced false detections are attributable to seizure-like artifacts such as respiration, sweating, etc. Our research group has recently undertaken the initiative to investigate this issue along with our clinical collaborators around the world.
Per patient performance is presented in table 3. The overall positive effect of the proposed temporal weighting of probabilities can be seen through the average ROC area across all patients which has been increased from 95.77 to 96.74; this corresponds to a ~22% relative improvement (96.74-95.77)/(100-95.77).
Table 3. Performance of the SVM-based seizure detection system with the temporal priors for each patient.
| Patient | 1 | 2 | 3 | 4 | 5 | 6 | 7 | 8 | 9 | 10 | 11 | 12 | 13 | 14 | 15 | 16 | 17 | 18 | Mean |
|---|---|---|---|---|---|---|---|---|---|---|---|---|---|---|---|---|---|---|---|
| ROC area | 96.7 | 99.9 | 94.2 | 90.7 | 96.7 | 96.1 | 98.8 | 99.5 | 99.0 | 95.2 | 97.1 | 96.5 | 98.1 | 96.3 | 97.8 | 93.1 | 97.2 | 98.5 | 96.74 |
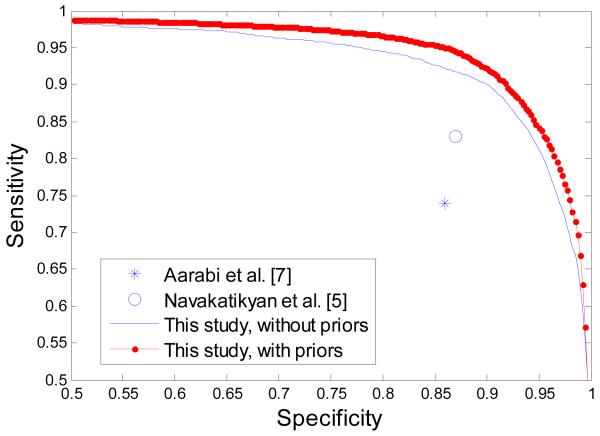
It is worth reemphasizing that unlike other studies which report performance increases obtained on datasets of several carefully selected minutes of EEG [4], the results in our study are obtained on the largest available dataset, which comprises 816 hours of continuous unedited neonatal EEG, and thus these results are stable and significant. The average ROC curve of the reported results is shown in figure 6. The results from recently published neonatal seizure detectors which compute the same metrics (Sensitivity and Specificity) are also plotted in figure 6. These systems reported single operating points in contrast to the complete curve of performance reported in this study.
Figure 6. A comparison with recently reported systems with the ROC metric.
4.2. Seizure burden and FD/h
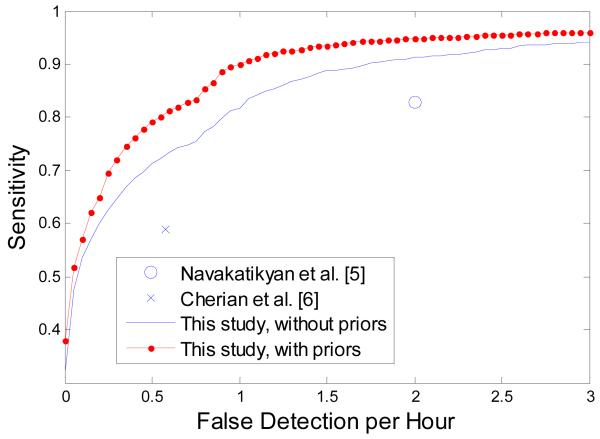
The contribution of the introduced weights in term of the clinically important metric is shown in figure 7. It can be seen that the number of false detection per hour is consistently lower when exploiting the designed weights for all operating points. In particular, the number of FD/h can be reduced from 0.45 to 0.25 while maintaining the correct detection of seizure burden as high as 70%. Comparing the time scale of the temporal weight change (~10% every ~10h) even with the maximum neonatal seizure duration (<1h), it can be concluded that the proposed modification affects the whole event rather than a particular part of it. A similar reduction in the number of FD/h from (0.38 to 0.24) is observed while maintaining the GDR as high as 65%.
Figure 7. Sensitivity vs. number of false detection per hour.
The provided performance curve facilitates a comparison among the various alternatives which report the same metrics. It can be seen from figure 7 that results reported in [5] and [6] could effectively be thought of as belonging to the same curve which is almost equally distanced from the curve of our results. It can be concluded that the claimed reduction in the number of FD/h in [6] comes therefore at a commensurable cost of reduced detected seizure burden. In other words, the 5 years of active research between the results presented in [5] and [6] have not advanced the state of the art, but have effectively repeated two points on the same performance curve.
A number of different metrics for the system presented in this study without temporal priors have been discussed and calculated in [19]. A more detailed analysis of the behavior of this system is possible, based on these metrics. Moreover, the various ways for performance assessment used in the literature for reporting the performance of neonatal seizure detectors have been outlined in [19, 29]. Together, this allows a proper quantitative comparison of the proposed system to the leading alternatives. Thus, a comparison and thorough review of alternatives have not been reported in this study but can be found in [19].
5. Extensions of this work
5.1. Spatiotemporal map of neonatal seizure observability
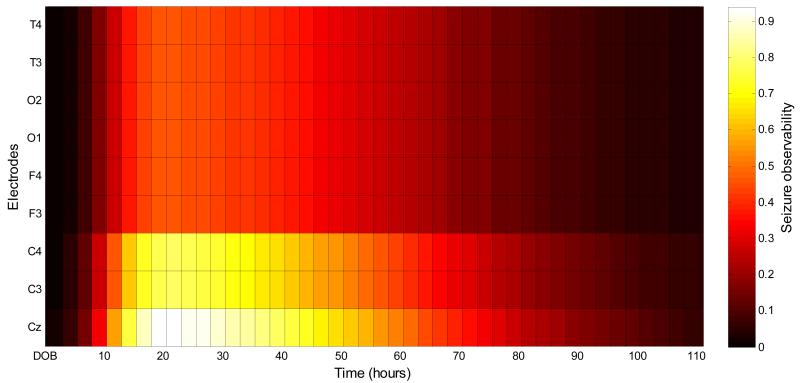
It could be beneficial for clinical usage to have a map of spatio-temporal seizure locations. Such a map would relate seizure spatial locations to seizure temporal locations with regard to the time of birth. This map could therefore focus the attention of a clinical EEG interpreter to certain brain locations, depending on the time elapsed from the birth of a neurologically compromised neonate. This could potentially result in higher detected seizure burden and contribute towards more efficient and timely seizure management. As an example of such a map, the most frequently chosen temporal seizure density function as reported in this work (figure 2(d)) is combined here with the spatial seizure locations. The latter were extracted from the statistics of neonatal seizure locations published in several clinical studies [25-27]. These statistics have been reported in detail in [10] and summarized here in table 4. It can be seen that given that a seizure happens, it is more probable to be observable in channels which include electrodes from the central zone rather than those from the temporal, frontal or occipital zones. Despite the fact that seizures are more common in the central regions most neonatologists at the cot-side will not recognize them as they are not trained neurophysiologists.
Table 4. The visibility of neonatal seizure taken from statistics given in clinical literature.
| Electrode | T4 | T3 | O1 | O2 | F4 | F3 | C4 | C3 | Cz |
|---|---|---|---|---|---|---|---|---|---|
| 0.46 | 0.46 | 0.46 | 0.46 | 0.46 | 0.46 | 0.78 | 0.78 | 0.94 |
The combination of the spatio-temporal seizure density is shown in figure 8. Intuitively, this figure indicates zones in time and space which should be given extra attention during EEG monitoring. For example, given that a patient is expected to develop seizures, it is most probable to see them in the central region between 15 and 30 hours after birth.
Figure 8. Seizure observability as a function of location and time.
The presented seizure observability map is useful in the absence of any patient-specific clinical information. A more accurate patient-specific spatiotemporal map of neonatal seizure propagation could be made based on dynamic spatial and temporal weight estimation. A study on dynamic spatial weighting for neonatal seizure detection has previously been reported by our group in [10] where static spatial weights have been combined with adaptively estimated dynamic patient-specific spatial weights to increase the seizure detection rate in the atypical cases. Below, a preliminary investigation into an adaptive temporal prior weighting is discussed.
5.2. Adaptive priors
In principle, adaptive online estimation of the prior function intends to target those patients whose seizure burden temporal evolution does not follow the common distribution. There can be many different ways to cope with this situation, such as changing the shape of the function adaptively by controlling the slope of the tail. In the preliminary attempt in this work, the function shape shown in figure 2(d) in red was left intact. Instead, the maximum of this function (which is directly related to the location parameter of the skewed Gaussian), is adaptively moved to the position of the current highest estimated seizure burden. To estimate the current seizure burden, a 1-hour window that is time-shifted every minute is applied to the SVM probabilistic output. The histogram is computed and the upper-half cumulative histogram is compared to the lower-half cumulative histogram. The maximum of the function is then moved to the new claimed point of the highest seizure burden.
It is worth noting that this simple adaptation does not introduce any delays into the real-time EEG monitoring and also does not change previous decisions, which is necessary in online EEG monitoring.
As expected, with this simple adaptation step no patients that follow the common distribution of seizure burden were affected. At the same time despite long missing data periods, it was possible to increase the performance in particular of patients 3 (from 94.2% to 96.0) and 4 (from 90.7 to 91.2) increasing the average ROC area further to 96.93%. This shows the potential of adaptive time-varying priors.
5.3. Future work
A neurological assessment can be performed soon after birth in the neonate and the severity of HIE can be graded. Different prior functions can be introduced for each HIE grade which will allow more accurate modeling of the temporal evolution of the seizure burden. Along with dynamic spatial and temporal weight estimation it will result in a more accurate seizure observability map.
It is also known that patient cooling procedures affect seizures in neonates with HIE [28]. It will therefore be necessary to re-estimate the reported priors on a cohort of newborns who are cooled to properly reflect the differences in seizure burden distributions.
6. Conclusions
A significant improvement in the performance of a patient independent neonatal seizure detector was achieved by the inclusion of a temporal prior weighting. This temporal weighting function was designed from the statistics of seizure location distributions relative to time of birth. The statistics are calculated from the largest available datasets of neonatal seizures. It was shown that the inclusion of the reported weighting function in the existing probabilistic framework results in the significant increase of the seizure detection performance measured by both epoch-based and event-based metrics. It was proposed here that a combination of both temporal and spatial priors offers a map of seizure observability. An additional improvement can be expected from adaptive patient-specific weight correction. The designed priors can be exploited in existing neonatal seizure detectors.
Acknowledge
This work was supported in part by the Science Foundation Ireland (10/IN.1/B3036) and the Welcome Trust (085249/Z/08/Z).
Footnotes
Publisher's Disclaimer: This is an author-created, un-copyedited version of an article accepted for publication in Journal of Neural Engineering. IOP Publishing Ltd is not responsible for any errors or omissions in this version of the manuscript or any version derived from it. The definitive publisher-authenticated version is available online at http://dx.doi.org/10.1088/1741-2560/9/4/046002
References
- [1].Rennie J, Boylan G. Treatment of neonatal seizures. Arch. Dis. Child. Fetal Neonatal. Ed. 2007;92:F148–50. doi: 10.1136/adc.2004.068551. [DOI] [PMC free article] [PubMed] [Google Scholar]
- [2].Murray D, Boylan G, Ali I, Ryan C, Murphy B, Connolly S. Defining the gap between electrographic seizure burden, clinical expression and staff recognition of neonatal seizures. Arch. Dis. Child. Fetal Neonatal. Ed. 2008;93:F187–91. doi: 10.1136/adc.2005.086314. [DOI] [PubMed] [Google Scholar]
- [3].Mitra J, Glover J, Ktonas P, Kumar A, Mukherjee A, Karayiannis N, Frost J, Hrachovy R, Mizrahi E. A multistage system for the automated detection of epileptic seizures in neonatal electroencephalography. J. Clin. Neurophysiol. 2009;26:218–226. doi: 10.1097/WNP.0b013e3181b2f29d. [DOI] [PMC free article] [PubMed] [Google Scholar]
- [4].Celka P, Colditz P. A computer-aided detection of EEG seizures in infants, a singular-spectrum approach and performance comparison. IEEE. Trans. Biomed. Eng. 2002;49:455–62. doi: 10.1109/10.995684. [DOI] [PubMed] [Google Scholar]
- [5].Navakatikyan M, Colditz P, Burke C, Inder T, Richmond J, Williams C. Seizure detection algorithm for neonates based on wave sequence analysis. Clin. Neurophysiol. 2006;117:1190–203. doi: 10.1016/j.clinph.2006.02.016. [DOI] [PubMed] [Google Scholar]
- [6].Cherian P, Deburchgraeve W, Swarte R, De Vos M, Govaert P, Van Huffel S, Visser G. Validation of a new automated neonatal seizure detection system: A clinician’s perspective. Clin. Neurophysiol. 2011;122:1490–99. doi: 10.1016/j.clinph.2011.01.043. [DOI] [PubMed] [Google Scholar]
- [7].Aarabi A, Grebe R, Wallois F. A multistage knowledge-based system for EEG seizure detection in newborn infants. Clin. Neurophysiol. 2007;118:2781–97. doi: 10.1016/j.clinph.2007.08.012. [DOI] [PubMed] [Google Scholar]
- [8].Mitchell M. Machine Learning. McGraw Hill; 1997. [Google Scholar]
- [9].Temko A, Thomas E, Marnane W, Lightbody G, Boylan G. EEG-based neonatal seizure detection with support vector machines. Clin. Neurophysiol. 2011;122:464–73. doi: 10.1016/j.clinph.2010.06.034. [DOI] [PMC free article] [PubMed] [Google Scholar]
- [10].Temko A, Lightbody G, Thomas E, Boylan G, Marnane W. Instantaneous Measure of EEG Channel Importance for Improved Patient-Adaptive Neonatal Seizure Detection. IEEE. Trans. Biomed. Eng. 2012;59:717–27. doi: 10.1109/TBME.2011.2178411. [DOI] [PMC free article] [PubMed] [Google Scholar]
- [11].Lynch N, Stevenson N, Livingstone V, Rennie J, Boylan G. The temporal evolution of electrographic seizure burden in neonatal hypoxic ischemic encephalopathy. Epilepsia. 2012;53:549–57. doi: 10.1111/j.1528-1167.2011.03401.x. [DOI] [PubMed] [Google Scholar]
- [12].Shah D, Boylan G, Rennie J. Monitoring of seizures in the newborn. Arch. Dis. Child. Fetal Neonatal. Ed. 2012;97:F65–69. doi: 10.1136/adc.2009.169508. http://dx.doi.org/10.1136/adc.2009.169508 [DOI] [PubMed] [Google Scholar]
- [13].Korotchikova I, Stevenson N, Walsh B, Murray D, Boylan G. Quantitative EEG analysis in neonatal hypoxic ischaemic encephalopathy. Clin. Neurophysiol. 2011;122:1671–78. doi: 10.1016/j.clinph.2010.12.059. [DOI] [PubMed] [Google Scholar]
- [14].Walsh B, Murray D, Boylan G. The use of conventional EEG for the assessment of hypoxic ischaemic encephalopathy in the newborn: A review. Clin. Neurophysiol. 2011;122:1284–94. doi: 10.1016/j.clinph.2011.03.032. [DOI] [PubMed] [Google Scholar]
- [15].Murray D, Boylan G, Ryan C, Connolly S. Early EEG findings in hypoxic-ischaemic encephalopathy predict outcome at 2 years. Pediatrics. 2009;124:e459–67. doi: 10.1542/peds.2008-2190. [DOI] [PubMed] [Google Scholar]
- [16].Pressler R, Binnie C, Cooper R, Robinson R. Neonatal and Paediatric Clinical Neurophysiology. Churchill Livingstone Elsevier; Amsterdam: 2007. [Google Scholar]
- [17].SVMlight - a collection of open-source software tools for learning and classification using SVM. http://svmlight.joachims.org/
- [18].Platt J. Probabilistic outputs for SVM and comparison to Regularized likelihood methods. Advances in Large Margin Classifiers. 1999 [Google Scholar]
- [19].Temko A, Thomas E, Marnane W, Lightbody G, Boylan G. Performance assessment for EEG-based neonatal seizure detectors. Clin. Neurophysiol. 2011;122:474–82. doi: 10.1016/j.clinph.2010.06.035. [DOI] [PMC free article] [PubMed] [Google Scholar]
- [20].Vapnik V. Estimation of Dependences Based on Empirical Data. Springer-Verlag; New York: 1982. [Google Scholar]
- [21].Mason S, Graham N. Areas beneath the relative operating characteristics (ROC) and relative operating levels (ROL) curves: Statistical significance and interpretation. Q. J. R. Meteorol. Soc. 2002;128:2145–66. [Google Scholar]
- [22].Hanley J, McNeil B. The meaning and use of the area under a receiver operating characteristic (ROC) curve. Radiology. 1982;143:29–36. doi: 10.1148/radiology.143.1.7063747. [DOI] [PubMed] [Google Scholar]
- [23].Hanley J, McNeil B. A method of comparing the areas under receiver operating characteristic curves derived from the same cases. Radiology. 1983;148:839–43. doi: 10.1148/radiology.148.3.6878708. [DOI] [PubMed] [Google Scholar]
- [24].Azzalini A. A class of distributions which includes the normal ones. Scand. J. Statist. 1985;12:171–78. [Google Scholar]
- [25].Shellhaas R, Clancy R. Characterization of neonatal seizures by conventional EEG and single-channel EEG. Clin. Neurophysiol. 2007;118:2156–61. doi: 10.1016/j.clinph.2007.06.061. [DOI] [PubMed] [Google Scholar]
- [26].Wusthoff C, Shellhaas R, Clancy R. Limitations of single-channel EEG on the forehead for neonatal seizure detection. J. Perinatol. 2009;29:237–42. doi: 10.1038/jp.2008.195. [DOI] [PubMed] [Google Scholar]
- [27].Bourez-Swart M, van Rooij L, Rizzo C, de Vries L, Toet M, Gebbink T, Ezendam A, van Huffelen S. Detection of subclinical electroencephalographic seizure patterns with multichannel amplitude-integrated EEG in full-term neonates. Clin. Neurophysiol. 2009;120:1916–22. doi: 10.1016/j.clinph.2009.08.015. [DOI] [PubMed] [Google Scholar]
- [28].Low E, Mathieson S, Stevenson N, Murray D, Rennie J, Boylan G. The effect of moderate hypothermia on the electrographic seizure burden in neonatal hypoxic ischaemic encephalopathy. Arch. Dis. Child. Fetal Neonatal. Ed. 2011;96:Fa27. [Google Scholar]
- [29].Vanhatalo S. Development of neonatal seizure detectors: an elusive target and stretching measuring tapes. Clin. Neurophysiol. 2011;122:435–7. doi: 10.1016/j.clinph.2010.07.021. [DOI] [PubMed] [Google Scholar]
- [30].Temko A, Nadeu C, Marnane W, Boylan G, Lightbody G. EEG Signal Description with Spectral-Envelope-Based Speech Recognition Features for Detection of Neonatal Seizures. IEEE. Trans. Inf. Technol. Biomed. 2011;15:839–47. doi: 10.1109/TITB.2011.2159805. [DOI] [PMC free article] [PubMed] [Google Scholar]
- [31].Kitayama M, Otsubo H, Parvez S, Lodha A, Ying E, Parvez B, Ishii R, Mizuno-Matsumoto Y, Zoroofi R, Snead O. Wavelet analysis for neonatal electroencephalographic seizures. Pediatr. Neurol. 2003;29:326–33. doi: 10.1016/s0887-8994(03)00277-7. [DOI] [PubMed] [Google Scholar]
- [32].De Weerd A, Despland P, Plouin P. Neonatal EEG. The International Federation of Clinical Neurophysiology. Electroencephalogr. Clin. Neurophysiol. Suppl. 1999;52:149–57. [PubMed] [Google Scholar]


