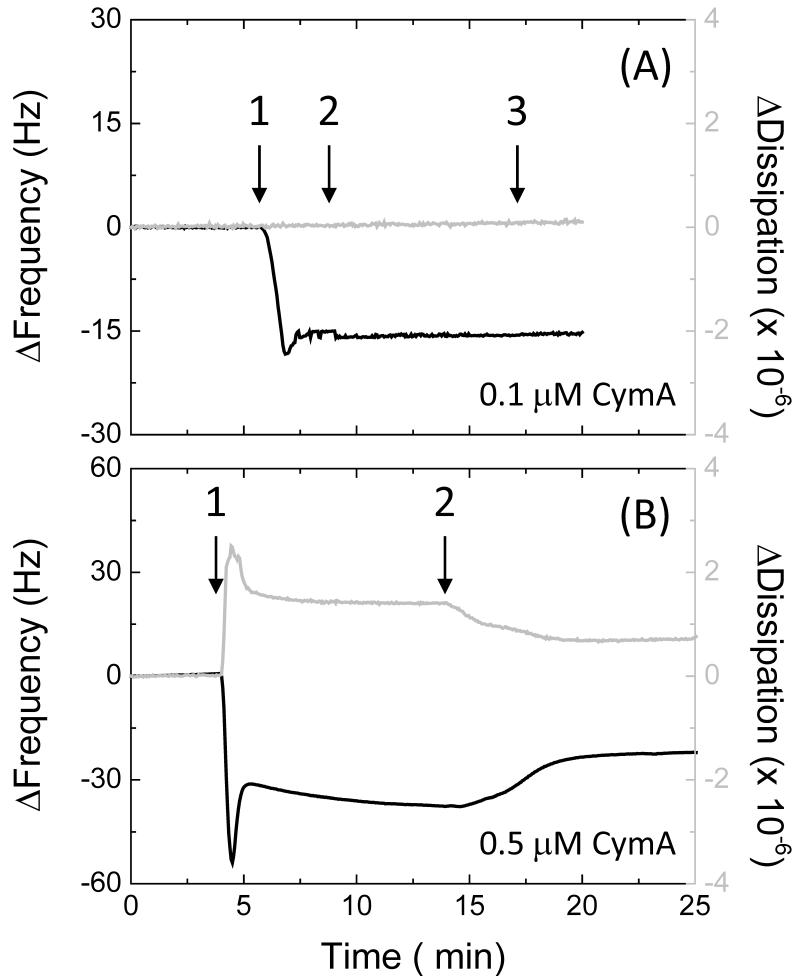
Fig. 4. QCM-D results in buffer with frequency (black line, left axis) and dissipation (grey line, right axis) against time for (A) a 8OH/8NH3+ (90/10) and (B) a pure 8OH modified gold surface.
Time points: 1, (A) 0.1 and (B) 0.5 μM CymA in buffer; 2, buffer only; 3, CV between 0.5 and −0.4 V versus SHE at 10 mV/s. The plots shown are representative of triplicate experiments.

