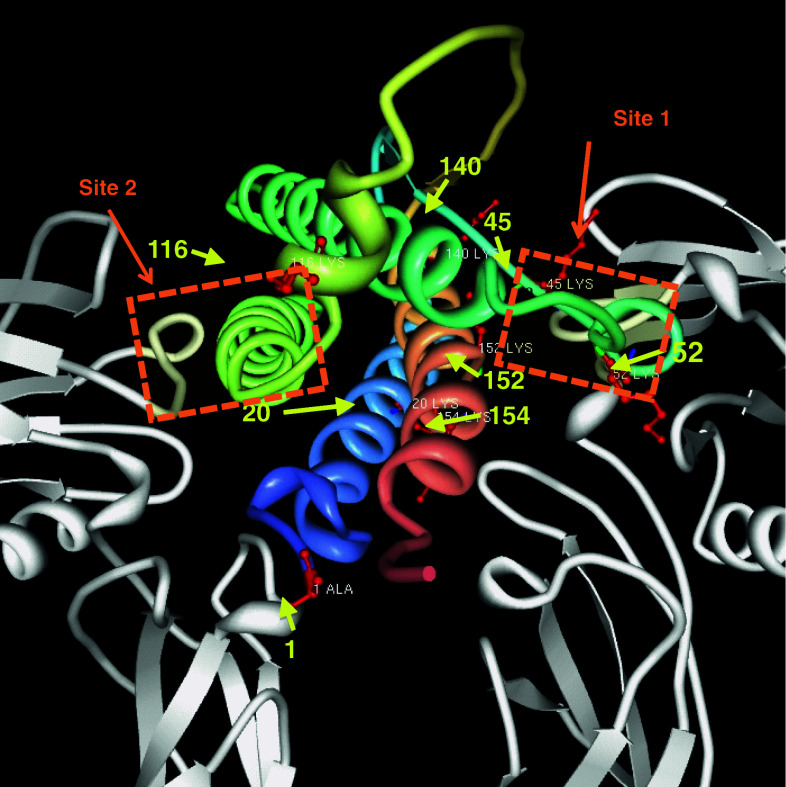
Fig. 2.
Crystal structure of EPO and EPOR (1EER, protein data bank). EPOR dimer is colored gray, and helices of EPO are shown multi-colored and bound to EPOR. The two active sites, site 1 and site 2, are indicated by orange boxes. Potential sites of carbamylation are indicated by red atoms, yellow arrows and residue number of the amino acid sequence

