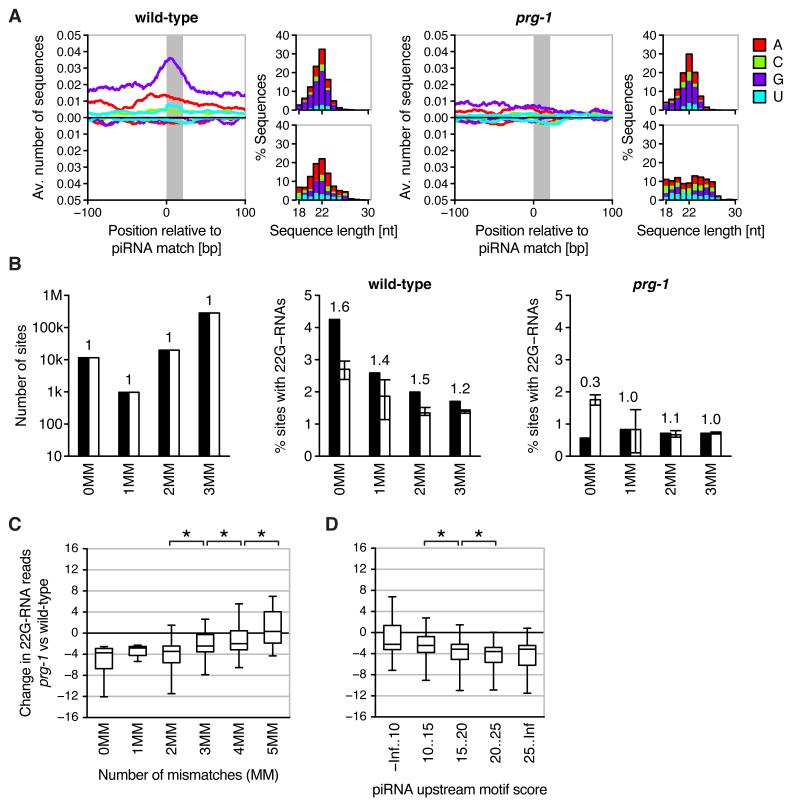
Fig. 3.
piRNAs initiate a localized secondary siRNA response against endogenous transcripts. (A) Average profiles of collapsed small RNAs mapping uniquely to imperfect genomic piRNA matches (1-3 mismatches) in wild-type (left) and prg-1 mutant (right). Top and bottom panels to the right of each profile illustrate characteristics of antisense and sense small RNAs, respectively. (B) Number of genomic piRNA matches (left) and percentage of matches with uniquely mapping 22G-RNAs in wild-type (middle) and prg-1 (right). Black and white bars correspond to piRNAs and matched controls, respectively. Bars for control sequences indicate medians, error bars the range of values obtained for 20 cohorts of control sequences. Numbers above bars indicate the fold-difference between piRNAs and controls. (C) Difference in 22G-RNAs mapping uniquely within 20 bp of genomic piRNA matches between prg-1 and wild-type. Shown are boxplots of the difference in 22G-RNA reads after square root transformation (box indicates interquartile range, plot extends from 5th to 95th percentile). Asterisks indicate statistical significance (P < 0.001, two-sided Wilcoxon rank-sum test). (D) As in (C) with genomic piRNA matches grouped according to motif score of complementary piRNA (as proxy for abundance).

