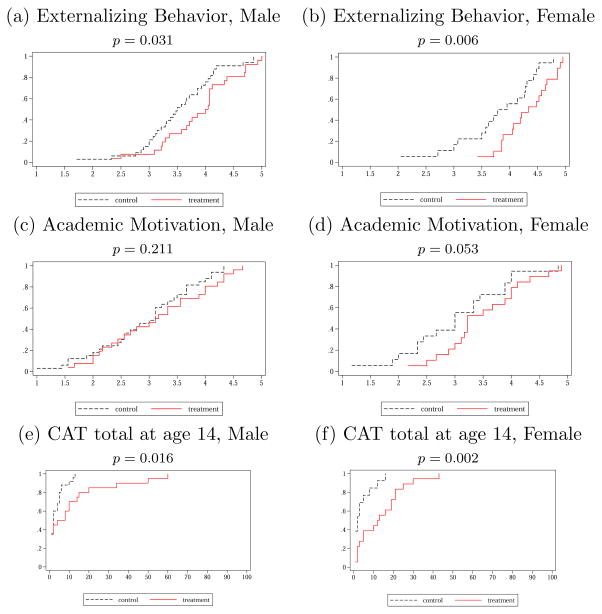
Figure 3. Cumulative Distribution Functions of Indices of Personality Skills and CAT scores by Gender.
Note: Indices for Externalizing Behavior and Academic Motivation are unweighted averages of measures listed in Table 2. “CAT” is the California Achievement Test score expressed in percentiles of the general population distribution of the scores. Numbers above the charts are one-sided p-values testing the equality of means of the indices for the treatment and control groups.

