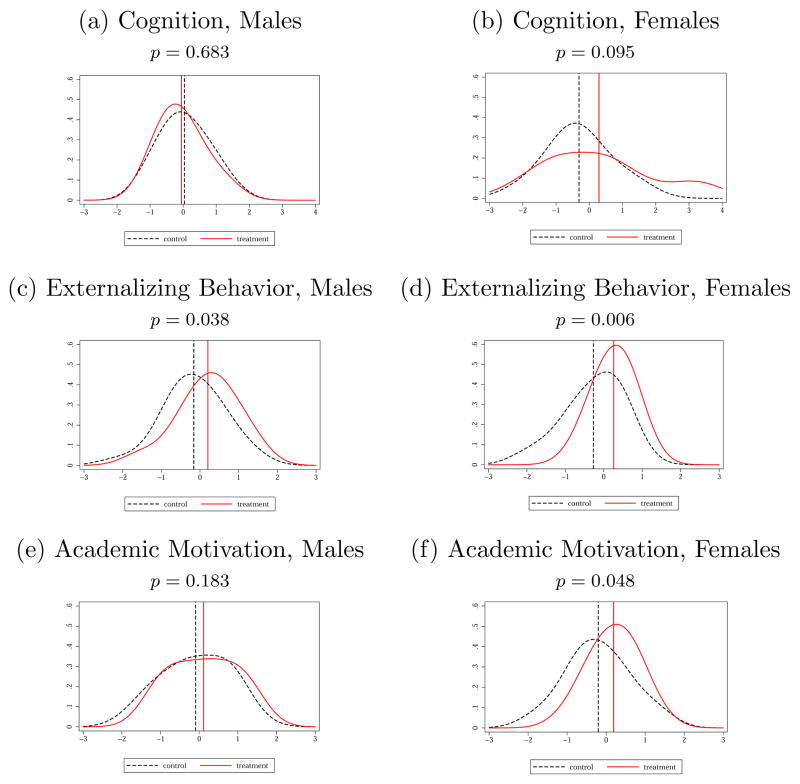
Figure 5. Kernel Densities of Factor Scores.
Note: Probability density functions of Bartlett (1937) factor scores are shown. Densities are computed based on a normal kernel. Numbers above the charts are one-sided p-values testing the equality of factor score means for the treatment and control groups. Higher Externalizing Behavior corresponds to more socially desirable behavior. See Web Appendix L for the empirical CDFs of the factor scores (Figure L.5). Vertical lines locate factor score means for treatment and control groups.

