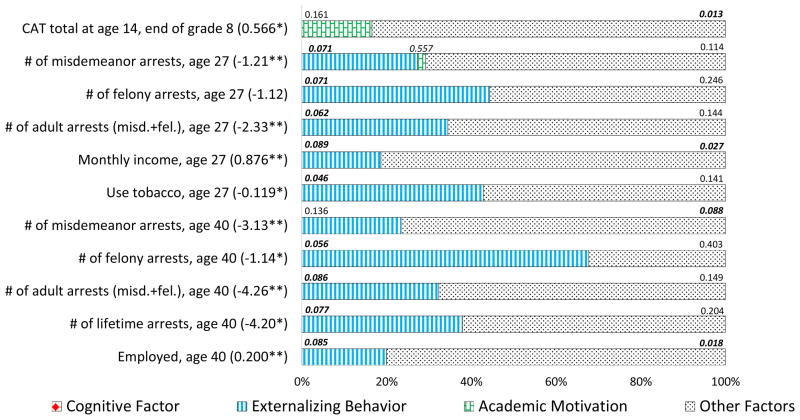
Figure 6. Decompositions of Treatment Effects on Outcomes, Males.
Note: The total treatment effects are shown in parentheses. Each bar represents the total treatment effect normalized to 100 percent. One-sided p-values are shown above each component of the decomposition. The figure is a slightly simplified visualization of Tables L.10 and L.14 : small and statistically insignificant contributions of the opposite sign are set to zero. See Web Appendix L for detailed information about the simplifications made to produce the figure. “CAT total” denotes California Achievement Test total score normalized to control mean zero and variance of one. Asterisks denote statistical significance: * – 10 percent level; ** – 5 percent level; *** – 1 percent level. Monthly income is adjusted to thousands of year-2006 dollars using annual national CPI.

