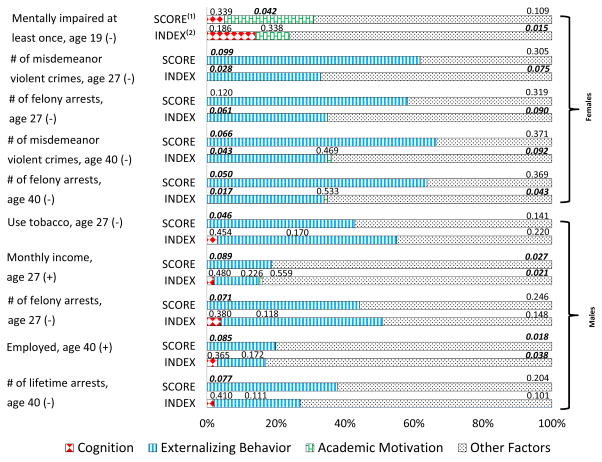
Figure 8. Decompositions of Treatment Effects by Indices versus Factor Scores.
Note: The total treatment effect is normalized to 100 percent. One-sided p-values are shown above each component in each outcome. (1) “SCORE” denotes models where personality traits are measured by factor scores.(1) “INDEX” denotes models where personality traits are measured by indices constructed using unweighted averages over the items. The figure is a slightly simplified visualization of results from Tables L.10, L.11, K.1, and K.2 of the Web Appendix: small and statistically insignificant contributions of the opposite sign are set to zero. See Web Appendix L for detailed information about the simplifications used to produce the figure.

