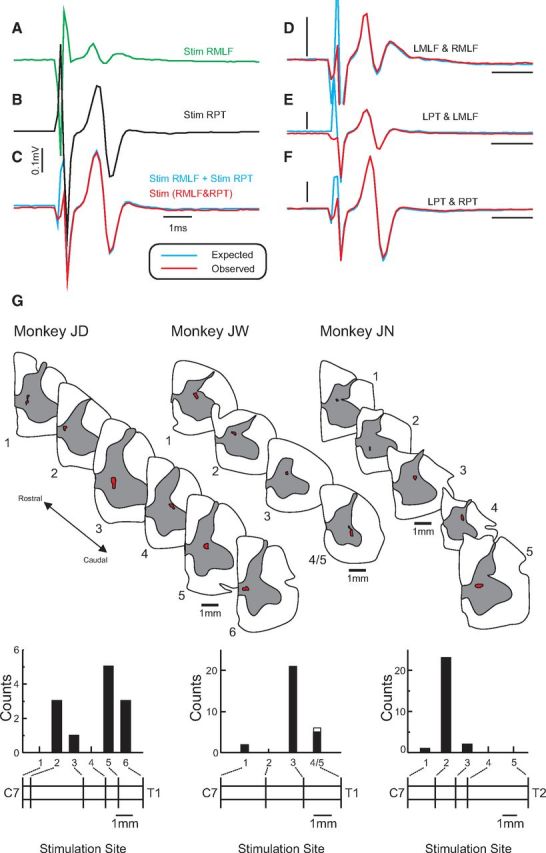
Figure 1.

Confirmation of the systems activated by electrical stimulation. A–F, Cord dorsum recordings of responses to brainstem stimulation. A, Response evoked by stimulation of the right MLF. B, Response evoked by stimulation of the right PT. C, Response evoked by simultaneous stimulation of both right PT and right MLF (red trace) superimposed on the sum of responses in A, B (blue trace). D, Same as in C but for combined stimulation of left and right MLF. E, Same as in C but for combined stimulation of left MLF and left PT. F, Same as in C but for combined stimulation of right and left PT. Stimulation intensity for PT/MLF was at 300 μA. G, Locations of intraspinal stimulating electrode tips in cervical spinal cord based on histological reconstructions of electrolytic lesions (red). Sections are shown for three experiments, which provided 72 of 81 of the motoneurons analyzed. The histograms underneath show the distribution of effects evoked and analyzed further from each electrode. The horizontal bars represent the relative distance between the electrodes, whereas the approximate segmental levels at the rostralmost and caudalmost electrodes are labeled. For monkey JW, the two most caudal intraspinal electrode tips were very close together, and it was not possible to separate the lesions. Accordingly, only one spinal section is shown (labeled 4/5). In subsequent figures, where possible, an inset figure is shown next to each response to indicate the location of the intraspinal electrode eliciting the response, labeled as in this panel.
