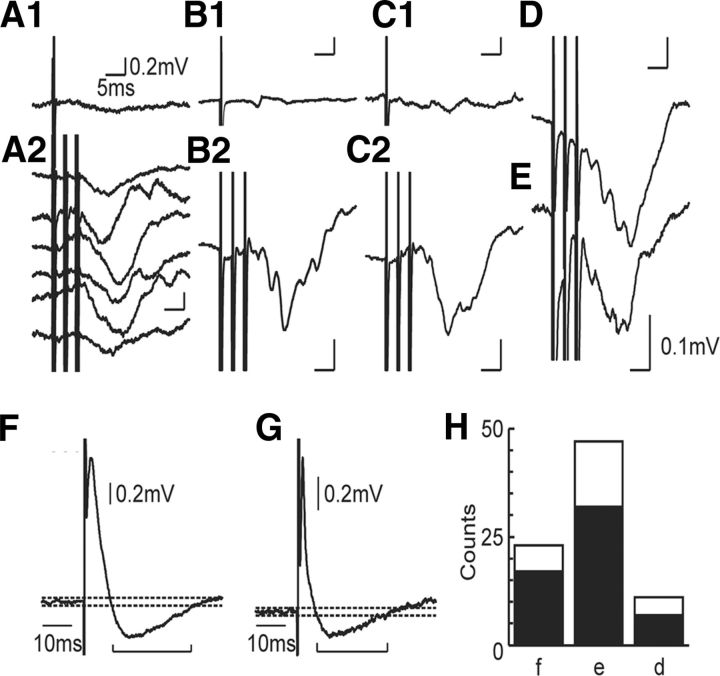
Figure 4.
Inhibitory responses to contralateral intraspinal stimulation. A–E, Averaged responses in five different motoneurons to cISMS stimulation. A–C, Responses in three different motoneurons in which single stimuli did not evoke consistent responses (A1,B1,C1), but IPSPs were evoked by trains of three stimuli (A2,B2,C2). In motoneuron A1, all six contralateral sites tested evoked IPSPs (all six averages are shown). D, E, Cells were not tested with single shock stimulation. F, G, Responses in two example motoneurons in which single cISMS stimuli evoked EPSPs that declined sharply to below the resting potential, suggesting that IPSPs as well as EPSPs were evoked. Dotted horizontal lines show potentials ± 3 SD of the prestimulus membrane potential; the potential fell to a significantly hyperpolarized level after the EPSP. H, Histogram indicating the fraction of tested motoneurons (total bar) showing an IPSP (black bar). Cells according to whether they project to forearm flexors (f), forearm extensors (e), or intrinsic hand muscles (d).

