
Figure 5. Representative flow plots of ICS results for CD56+ NK cells by viral ICS.
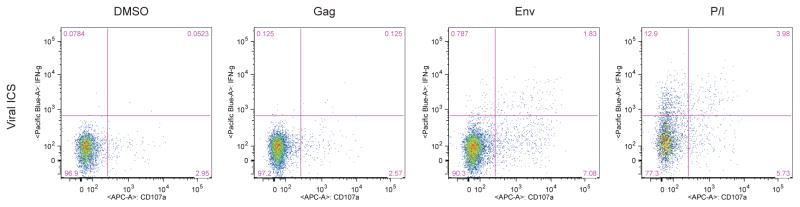
The plots show the gating for a representative HIV-positive sample stimulated for five hours with DMSO, PTE peptide pools for Gag and Env and PMA/Ionomycin. Plots show IFNγ secretion and CD107a externalization by CD56+ cells as detected by viral ICS.