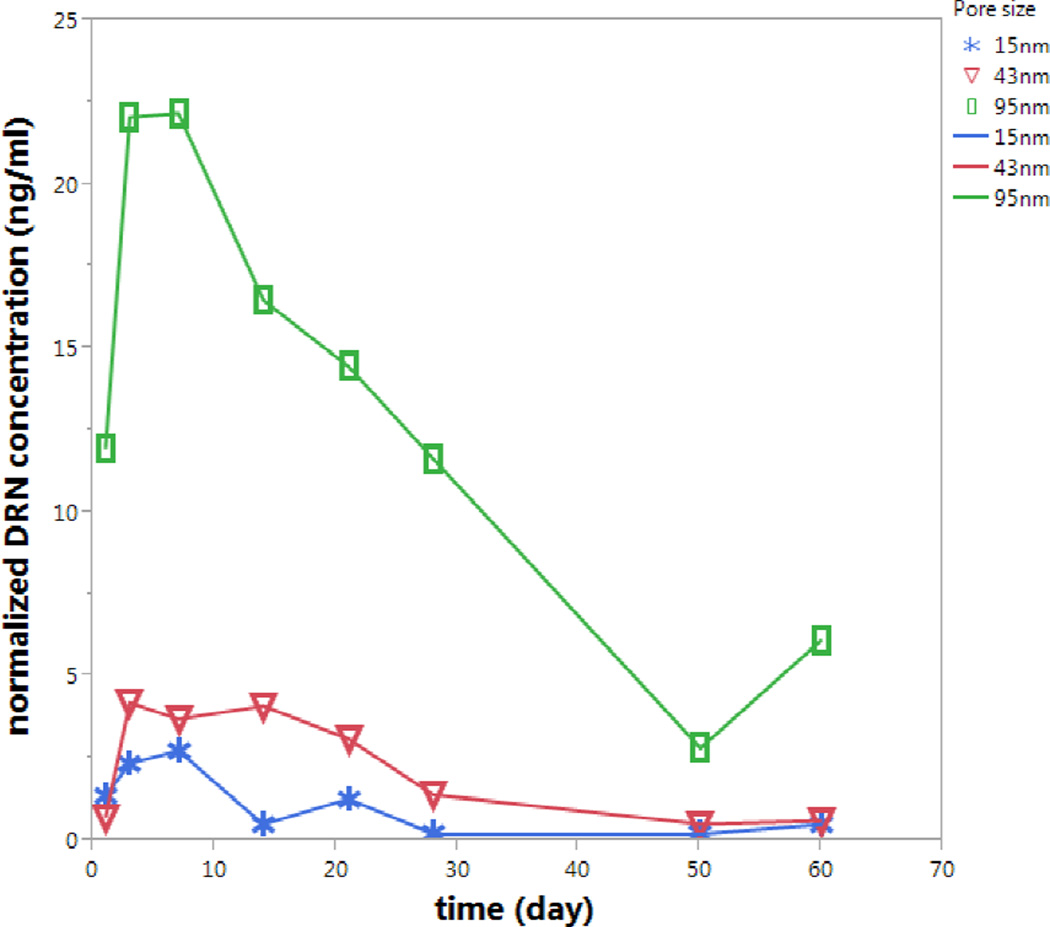
Figure 5.
DNR concentration detected by LC-MS/MS in the dynamic in vitro release apparatus. A burst release is observed at day 1–3. After wards, DNR release was sustained until the end of the 60-day observation period. Compared to particles A (blue trace, bottom) and C (red trace, middle), particle D (green trace, top) showed the largest drug level released at each time point. The data was normalized using the initial drug amount in the starting porous silicon particles used.

