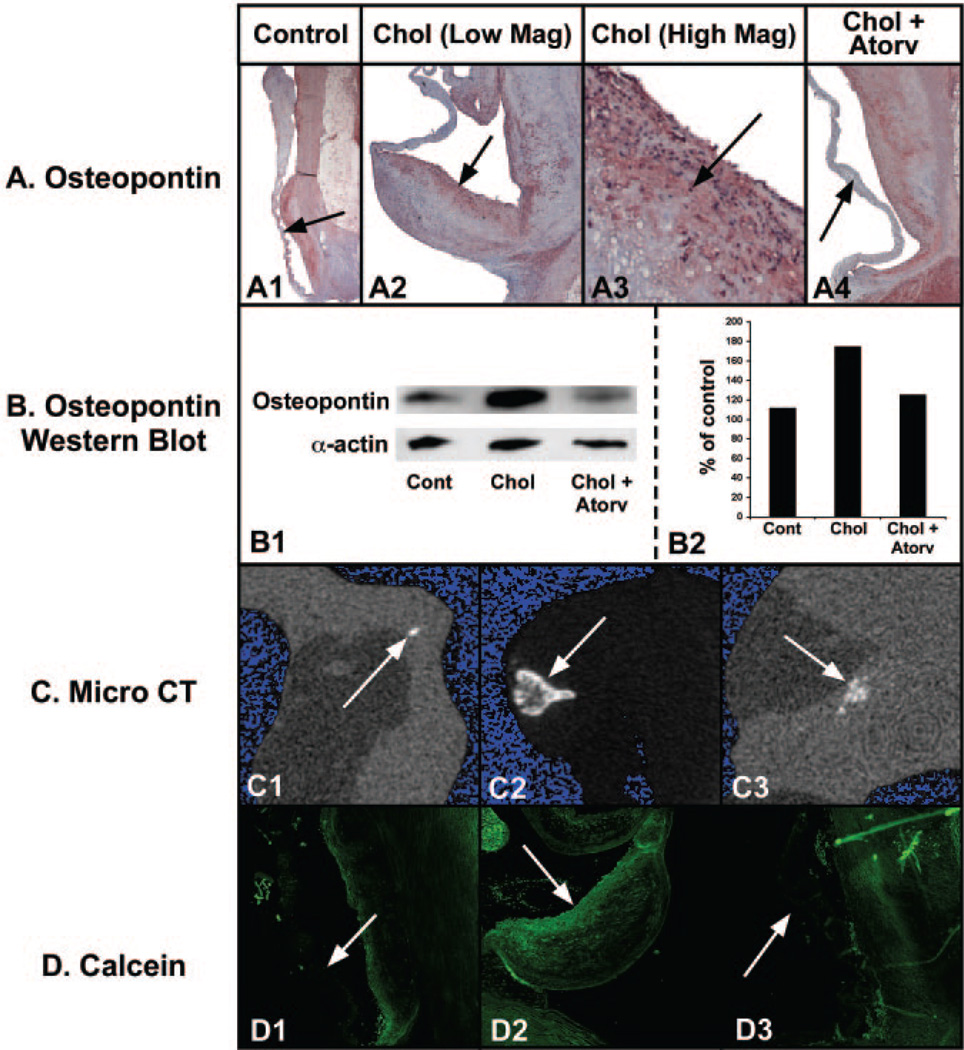
Figure 3.
Establishment of the bone-like phenotype in the calcified aortic valves. Left column, control diet; middle column, cholesterol diet; right column, cholesterol diet plus atorvastatin. A, Osteopontin immunostain light microscopy; aortic valve on the left and aorta on the right. Arrow points to aortic valve in each figure. All frames 12.5× magnification. B, Osteopontin Western blot and quantification. C, micro-computed tomography 2-dimensional reconstructed slices of each valve (3.4 mm horizontal field of view). D, Confocal microscopy of the calcein labeling in the mineralizing valve.

