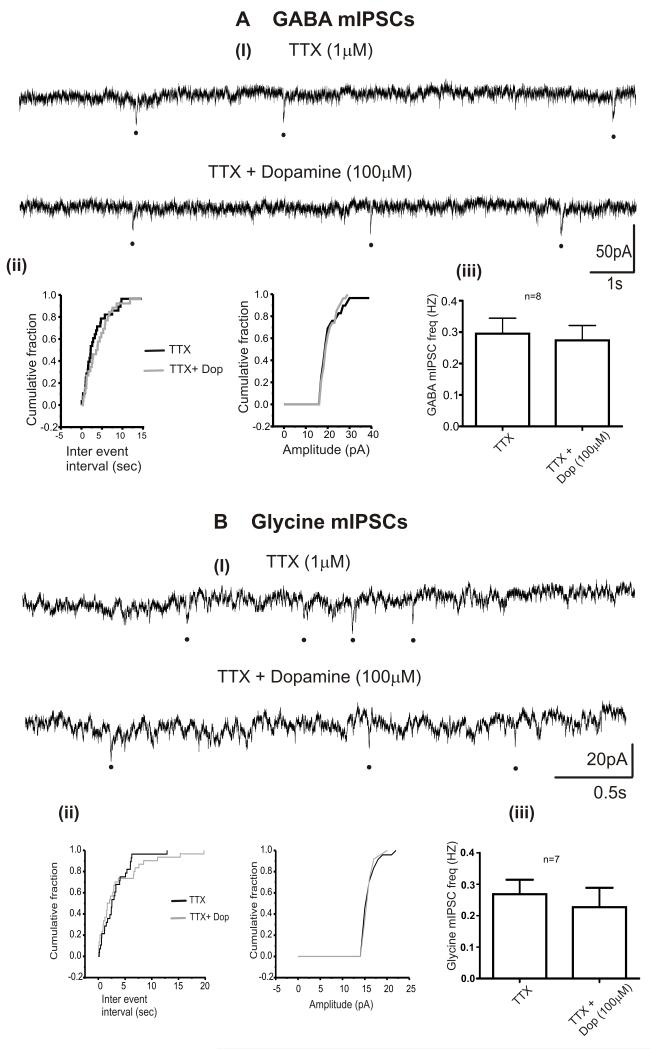
Figure 4. Dopamine induced effects on inhibitory neurotransmission to CVNs are action potential mediated.
A, B. Representative traces from a typical experiment isolating for GABAergic (Ai) and glycinergic (Bi) miniature IPSCs in the presence of TTX and TTX + dopamine (100 M). A, ii and B, ii. The cumulative probability distribution curves plotted for inter event interval and amplitude of GABA and glycinergic IPSCs respectively while superfusing TTX (1 M, black line) and TTX + Dopamine (grey line, 100 M). A, iii and B, iii. The summary data showing the effect of dopamine on the frequency of GABAergic (n=8). and glycinergic miniature IPSCs (n=7). Black dots represents miniature IPSCs.

