Figure 3.
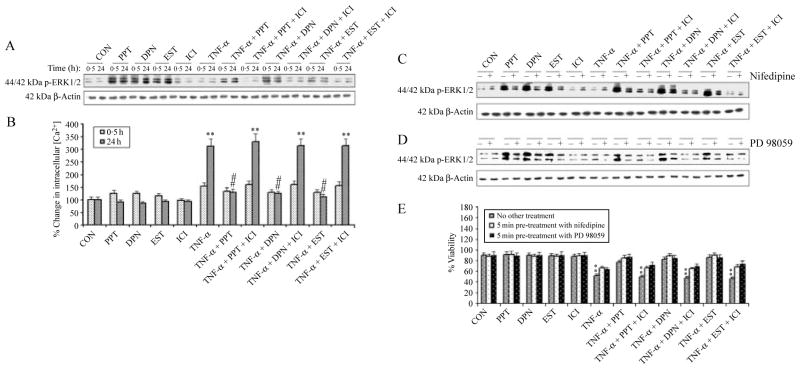
Determination of ERK phosphorylation, intracellular free [Ca2+], and involvement of L-type Ca2+ channels in VSC4.1 cells. Treatment groups: control (CON); 50 nM PPT (24 h); 50 nM DPN (24 h); 150 nM EST (24 h); 10 μM ICI (24 h); 50 ng/ml TNF-α (24 h); 50 ng/ml TNF-α (24 h)+PPT (treatment at 15 min post TNF-α exposure); 50 ng/ml TNF-α (24 h)+PPT (treatment at 15 min post TNF-α exposure)+ICI (treatment at 20 min post TNF-α exposure); 50 ng/ml TNF-α (24 h)+DPN (treatment at 15 min post TNF-α exposure); 50 ng/ml TNF-α (24 h)+DPN (treatment at 15 min post TNF-α exposure)+ICI (treatment at 20 min post TNF-α exposure); 50 ng/ml TNF-α (24 h)+EST (treatment at 15 min post TNF-α exposure); 50 ng/ml TNF-α (24 h)+EST (treatment at 15 min post TNF-α exposure)+ICI (treatment at 20 min post TNF-α exposure). (A) Posttreatment with PPT, DPN, or EST rapidly increased ERK phosphorylation. Western blot analysis to show levels of phosphorylation of p44/42 ERK1/2 at 0·5 and 24 h. (B) Determination of intracellular free [Ca2+] at 0·5 and 24 h. Western blot analysis to show levels of phosphorylation of p44/42 ERK1/2 after posttreatment with nifedipine (C) and PD98059 (D). (E) Treatment with nifedipine and PD98059 increased cell viability. Trypan blue dye exclusion assay was used to assess cell viability. **P<0·01 compared to control.

