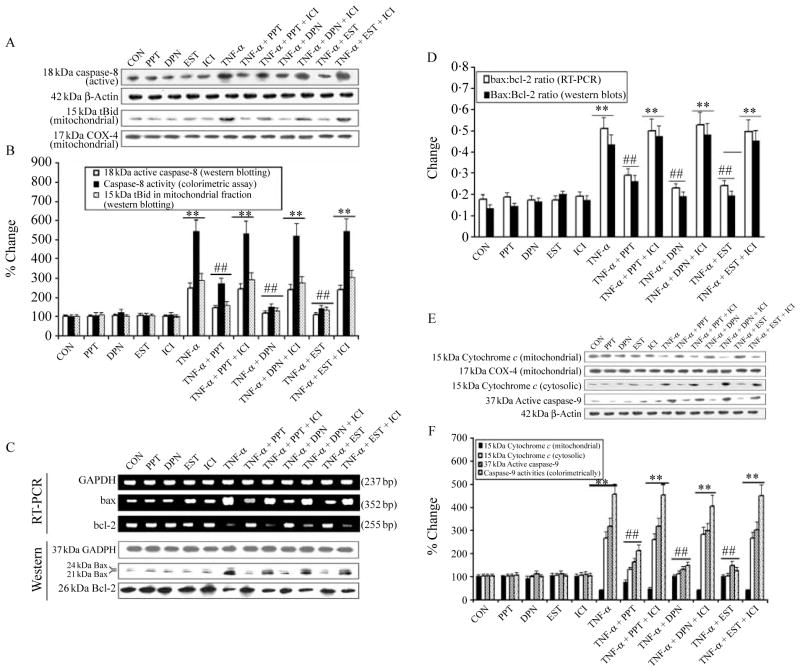
Figure 5.
Examination of components involved in extrinsic and intrinsic apoptotic pathways. Treatment groups: control (CON); 50 nM PPT (24 h); 50 nM DPN (24 h); 150 nM EST (24 h); 10 μM ICI (24 h); 50 ng/ml TNF-α (24 h); 50 ng/ml TNF-α (24 h)+PPT (treatment at 15 min post TNF-α exposure); 50 ng/ml TNF-α (24 h)+PPT (treatment at 15 min post TNF-α exposure)+ICI (treatment at 20 min post TNF-α exposure); 50 ng/ml TNF-α (24 h)+DPN (treatment at 15 min post TNF-α exposure); 50 ng/ml TNF-α (24 h)+DPN (treatment at 15 min post TNF-α exposure)+ICI (treatment at 20 min post TNF-α exposure); 50 ng/ml TNF-α (24 h)+EST (treatment at 15 min post TNF-α exposure); 50 ng/ml TNF-α (24 h)+EST (treatment at 15 min post TNF-α exposure)+ICI (treatment at 20 min post TNF-α exposure). (A) Western blotting to show levels of caspase-8, β-actin, tBid, and COX4. (B) Densitometric analysis showing percent change in OD of the caspase-8 and tBid bands and determination of caspase-8 activity (colorimetrically). (C) Alteration in Bax and Bcl-2 expression at mRNA and protein levels. Representative pictures to show Bax, Bcl-2, and GAPDH at mRNA (RT-PCR) and protein (western blotting) levels after different treatments. (D) Densitometric analysis showing the Bax:Bcl-2 ratio. (E) Western blotting to show levels of cytochrome c, COX4, caspase-9, and β-actin. (F) Densitometric analysis showing percent change in OD of the mitochondrial and cytosolic 15 kDa cytochrome c and 39 kDa active caspase-9, and determination of caspase-9 activity (colorimetrically). **P<0·01 compared to control; ##P<0·01 compared to TNF-α.

