
Figure 4.
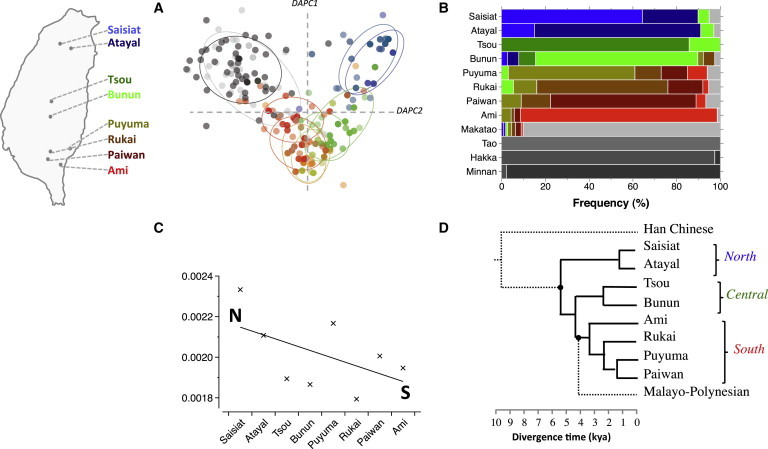
Into and Out of Taiwan
(A) Map location of highland Formosan tribes and DAPC plot; individuals are dots, groups are circles, color corresponds to eight Formosan groups and two Han groups in gray.
(B) Stepping-stone haplotype sharing across 12 groups. Han/lowland Taiwanese groups are in gray and the frequency of haplotypes shared with/with other groups are colored according to the map.
(C) Formosan nucleotide diversity declines from north (N) to south (S).
(D) Formosan tribal relationships based on complete mtDNA sequences; dotted lines are non-Formosan groups.