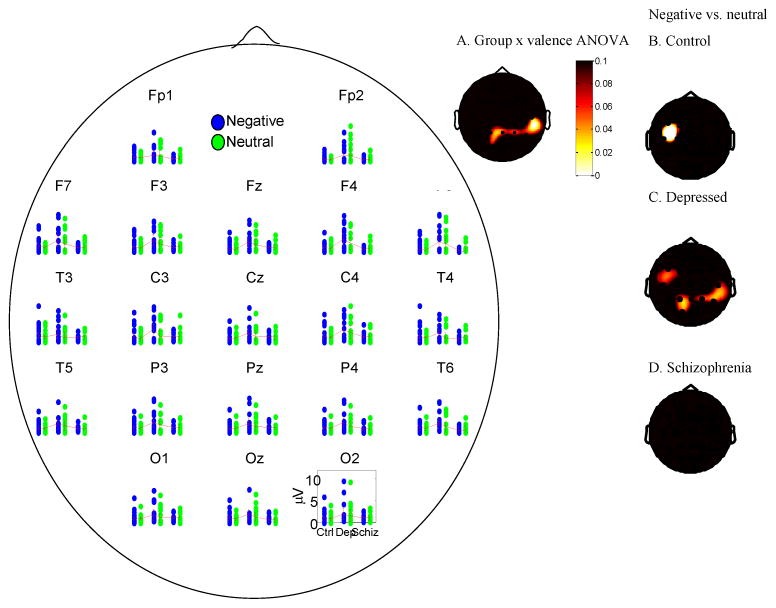
Figure 3.
Scatterplot and 95% confidence intervals showing gamma power for all participants in response to negative and neutral words 3–4 seconds following stimulus onset minus a pre-stimulus baseline. A. Scalp map of p-values from a group 3-way ANOVA (depressed, control, schizophrenia) on the contrast of negative minus neutral words in which trial-related gamma power 3–4 seconds following the offset of the stimulus minus a pre-stimulus baseline. The groups differed in parietal regions as a function of valence. B–D. Scalp maps of within-group differences in gamma power to negative and neutral words 3–4 seconds following stimulus offset minus a pre-stimulus baseline, showing that the primary ANOVA was driven by differences present in depressed participants compared to the other groups.

