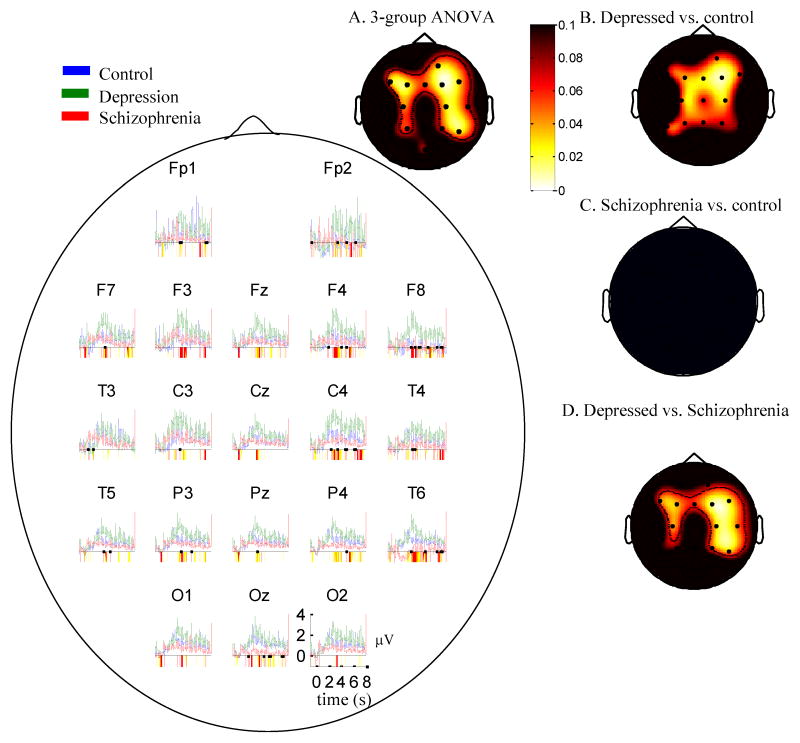
Figure 4.
Mean EEG gamma power (35–45 Hz) over time for age-matched subsamples in each group in response to negative words. Periods of significant differences between groups are highlighted below the x-axis (yellow (light gray in black/white): p<0.1; red (dark gray in black/white): p<0.05). a. Scalp map for three group ANOVA (control, depression, schizophrenia) 3–4 seconds after stimulus offset minus a pre-stimulus baseline. B–D. Two-group contrast maps analogous to those in Figure 1. Whiter values represent lower p-values. Depressed individuals displayed increased high-frequency activity compared to the other groups throughout the scalp.

