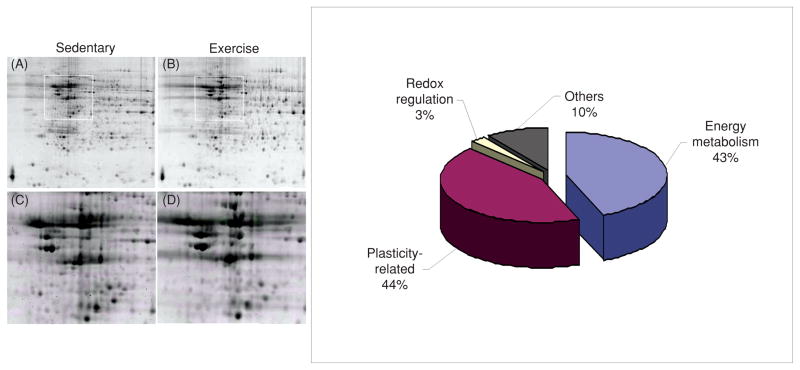
Figure 9.
Proteomic analysis showing preponderant action of exercise on proteins associated with energy metabolism and synaptic plasticity. Representative two-dimensional gels of the hippocampus from sedentary (panel A) and exercise (panel B) rats. The boxes in A and B represent the areas enlarged in C and D showing the position of protein spots. The diagram on the right illustrates the relative proportion of protein types stimulated by voluntary exercise. Modified, with permission, from reference (48), p. 1270

