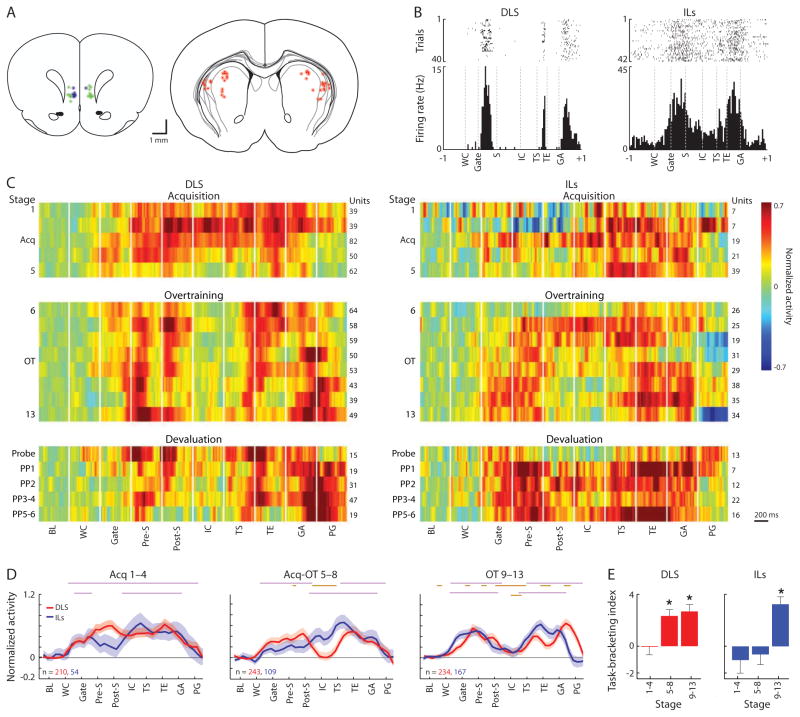
Figure 2. Formation of Task-Bracketing Activity in DLS and ILs.
(A) Schematic sections of tetrode recording locations (circles) in IL cortex (left) and DLS (right). IL recordings split by mediolateral position into “superficial” (blue) and “deep” (green) placements. Circle sizes indicate estimated recording coverage (inner circle: 0.05 mm radius of peak spike recording; outer halo: 0.14 mm radius of maximal recording; from (Henze et al., 2000). See also Figure S5C.
(B) Spike raster plots (top) and histograms (bottom) of sample DLS (left) and ILs (right) units recorded during over-training (50 ms bins, ±1 sec before and after run). Peri-event windows display middle half of median peri-event time between the prior and next events, averaged across trials. WC: warning cue; Gate: gate opening; S: run start; IC: instruction cue; TS: turn start; TE: turn end; GA: goal arrival.
(C) Normalized (baseline-subtracted Z-scores) activity of DLS (left) and ILs (right) task-related units, for 7 rats, constructed from abutted ±200 ms peri-event periods (20-ms bins) during acquisition (stage 1–5), over-training (6–13), and post-devaluation probe and rewarded (PP1-6) sessions. Number of units and color scale at right. BL: baseline; Pre-S: 200 ms before run start; Post-S: 200 ms after run start; PG: 0.5 sec after goal arrival.
(D) Activity in ±200 ms peri-event windows (100-ms bins), for DLS (red) and ILs (blue), for successive training stages (Acq: 1-4; Acq-early OT: 5–8; late OT: 9–13). Number of task-related units at lower left. Purple bars: bins with activity significantly different from pre-run baseline; orange bars: significant difference from activity in same time-bins in Acq1-4 (p < 0.05).
(E) Index of task-bracketing ensemble pattern strength (mean activity in start and end periods minus mean mid-run activity) across training stages and recording locations. *p < 0.05 from zero.
See also Figure S1.

