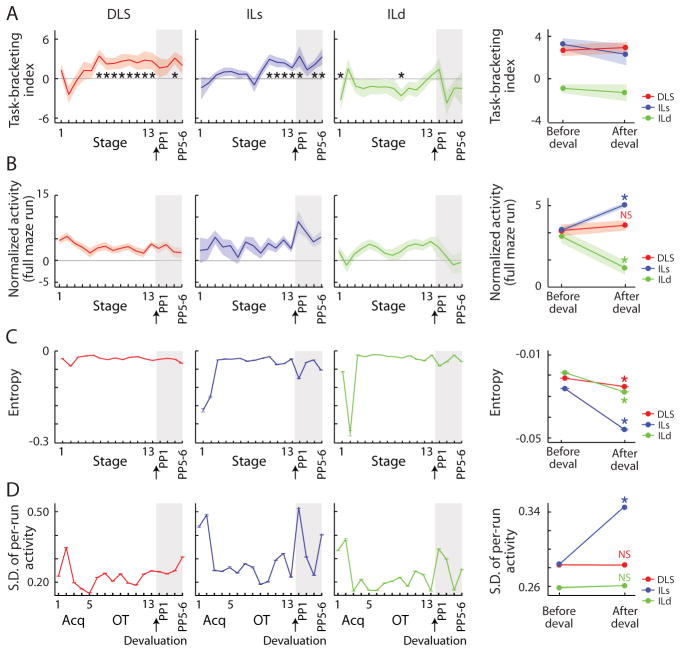
Figure 5. Fluctuations in Firing Strength and Variability Related to Learning and Devaluation.
Task-bracketing index (A), baseline-subtracted raw firing during the full run (from start to goal, B), entropy of ensemble spike activity during the full run across trials within a session (SEM of 1000 bootstrapped units, C), and standard deviation of ensemble spike activity during full maze runs (SEM of 1000 bootstrapped units, D), calculated for ensemble activity by recording site and training stage. At right, averages over five stages before and after devaluation. *p < 0.05 compared to no index (zero, left panels) or to before devaluation (right panels).
See also Figure S3.

