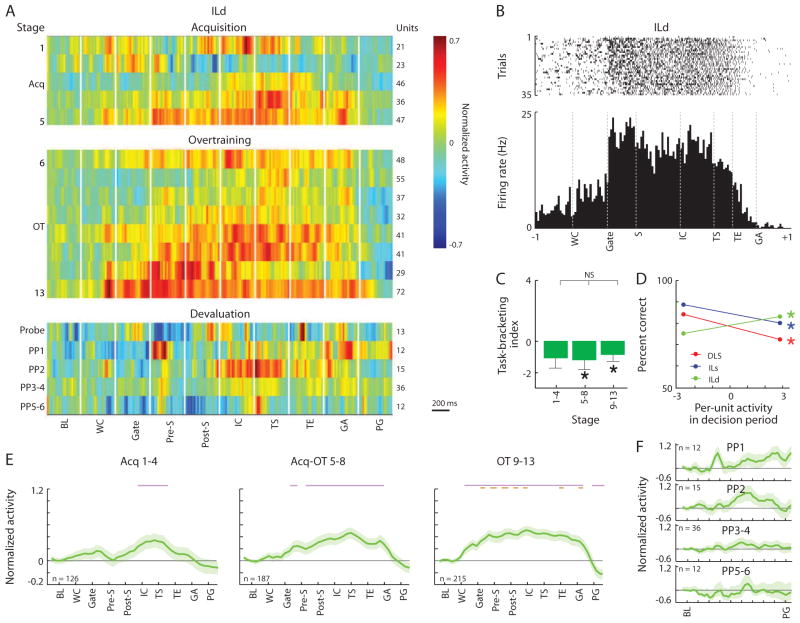
Figure 6. Distinct Pattern of Activity in ILd during Habit Learning.
(A) Ensemble activity of ILd units in individual training stages, as in Figure 2C.
(B) Raster plot and histogram of single ILd unit activity during an over-training session, as in Figure 2B.
(C) ILd task-bracketing activity index, as in Figure 2E. *p < 0.05.
(D) Opposite changes in decision-period activity in ILd compared to ILs and DLS. Regression line between normalized activity of each task-related unit during the decision period (from cue onset to turn start, 0 = baseline) and performance accuracy, for training stages 1–13. *p < 0.05.
(E and F) Normalized activity of ILd units across learning stages (E), and across PP stages (F), as in Figures 2D and 3D.
See also Figure S4.

