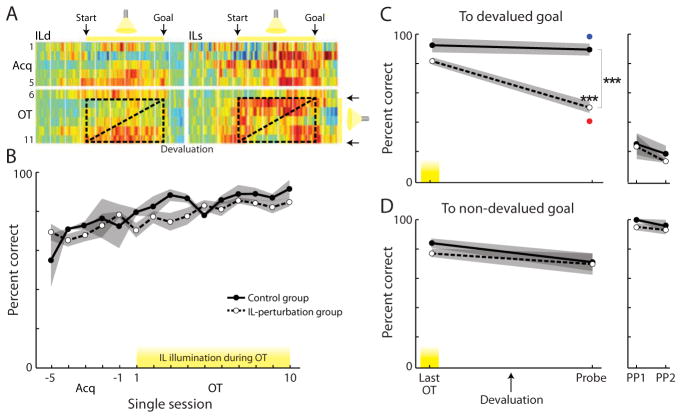
Figure 8. Optogenetic Perturbation of IL Cortex Blocks Habit Formation.
(A) Light delivery, related to IL activity, from run start to stop, for 10 OT days only (stages 7–11). Box demarcates time of IL illumination.
(B) Performance accuracy during last 5 Acq sessions and 10 OT sessions. No effect of light on performance: session (F = 4.80, p < 0.001; group, F = 2.82, p = 0.10; interaction, F = 0.63, p = 0.84).
(C) Correct turns to devalued goal on last OT day with IL light and on post-devaluation probe day without light. Group, F = 44.80, p < 0.001; session, F = 21.12, p < 0.001; interaction, F = 14.44, p < 0.01. Interaction of goal value and group on probe day: F = 18.46, p < 0.001. ***p < 0.001 post-hoc. All other comparisons p > 0.05. Red dot = normal CT devaluation-sensitive behavior from Figure 1; blue = normal OT devaluation-insensitive behavior. Right, behavior during PP days.
(D) Correct runs to non-devalued goal, which did not change (group, F = 0.52, p = 0.48; session, F = 3.51, p = 0.078; interaction, F = 0.23, p = 0.64).

