
Figure 4.
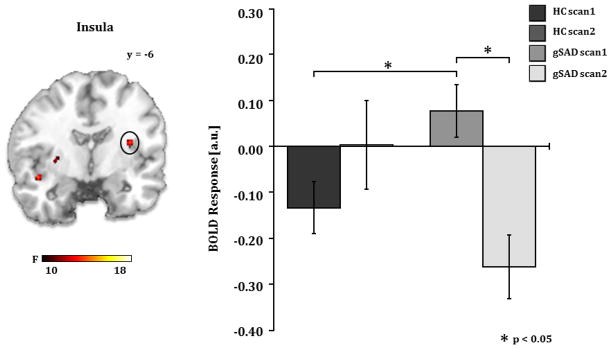
A) Brain map depicting whole-brain voxel-wise ANOVA F-map at p<0.001 showing a significant Group x Time interaction in the insula in response to angry faces. B) Bar graph depicts extracted BOLD signal change from insula region of interest showing insula reactivity to angry faces is greater in gSAD than the HC group at pre-treatment (gSADPre-Tx > HCScan 1, p<0.02) and is reduced by treatment (gSADPre-Tx > gSADPost-Tx, p<0.002). gSAD, Generalized Social Anxiety Disorder; Healthy Control (HC)