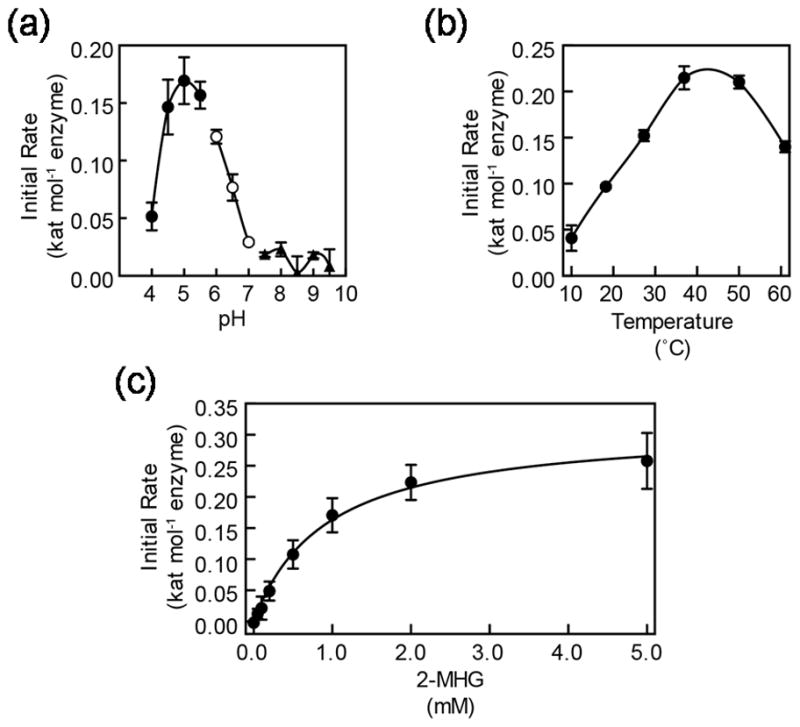
Figure 2.

Kinetic characterization of CD1/SlCUS1. (a) The pH optimum of CD1/SlCUS1 assayed at 37°C for 2 h in buffers of respective pH values. Buffers used were sodium acetate, closed circles; sodium phosphate, open circles; Tris-HCl, closed triangles. (b) The temperature optimum of CD1/SlCUS1 assayed for 2 h at the respective temperatures in pH 5.0 buffer. (c) The effect of 2-MHG concentration on initial reaction rate. Data were fit to the Michaelis-Menten model as shown. Error bars represent standard deviation for triplicate reactions.
