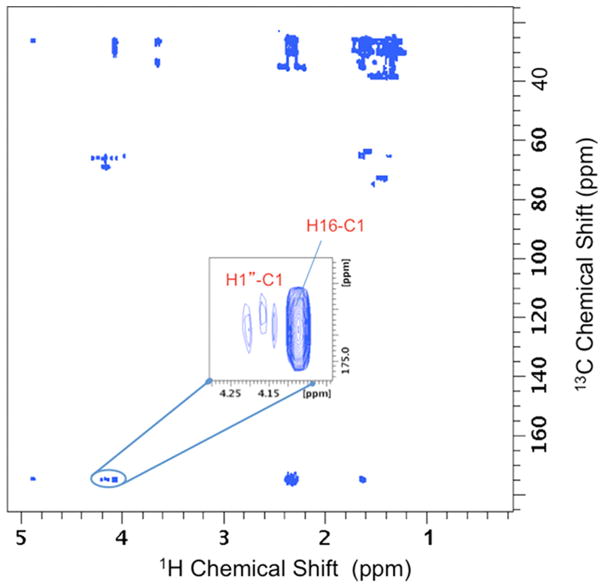
Figure 4.
2D 1H-13C HMBC NMR contour plot for MHG oligomers. The H16-C1 correlation indicates formation of a linear oligomeric product involving esterification of a primary alcohol. The weaker correlations in this region correspond to H1″-C1 connectivities in the 1-MHG oligomer. Additional carboxyl carbon correlations in this region are identified in Figure S2.

