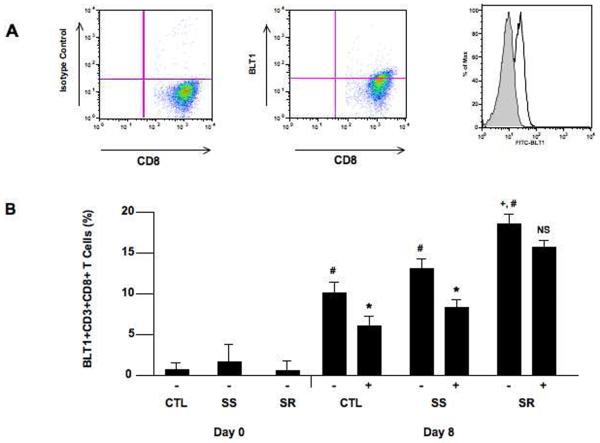
Figure 2.
BLT1 expression on stimulated CD8+ T cells. Isolated CD8+ T cells were stimulated with anti-CD3/anti-CD28 for 8 days and BLT1 expression was assessed by flow cytometry. A) Representative plots are illustrated. Representative data showing isotype control staining (left panel) and BLT1 expression (center panel). The right panel shows the flow analysis of BLT1 staining and the discrimination between the FITC-isotype control and FITC-BLT1 monoclonal antibody staining. B) BLT1 expression on unstimulated and stimulated CD8+ T cells in the presence or absence of dexamethasone (Dex). #P<0.05 comparing unstimulated to stimulated group. *P<0.05 comparing steroid treated to non-treated group. +P<0.05 comparing SR to CTL and SS groups. −: no Dex, +: includes Dex.

