

Abstract
A total of 1,734 adults performed two running memory tasks and a battery of cognitive tests representing four cognitive abilities. Simultaneous analyses were used to identify unique relations of each cognitive ability, including fluid intelligence, on the running memory measures. The large sample size allowed powerful analyses of the relations at the level of individual trials, separate list lengths, and different serial positions. The results indicated that the relations of running memory performance with cognitive abilities were remarkably constant from the first to the last trial, across different list lengths, and on successive input positions. It is proposed that an important aspect of fluid intelligence is the ability to cope with novelty and complexity, and that running memory tasks may merely be one of many ways in which those processes can be operationalized.
A great deal of research has investigated relations between working memory (WM) and fluid intelligence (Gf), and meta-analysis estimates of the relations have ranged from about .4 to .8 (Ackerman et al. 2005; Kane et al. 2005, Oberaurer et al. 2005). These correlations indicate that people who are more successful at performing WM tasks are also better at Gf tests, but there is still little consensus with respect to what is responsible for the relations, or even the direction of the relations1.
The rationale for the current study was that it may be possible to gain insight into the reasons for the WM-Gf association by examining the relations at the level of individual items. That is, when the sample is sufficiently large, correlations can be decomposed to examine WM-Gf relations across items at different levels of difficulty, or across successive trials representing different amounts of experience on the task.
An early example of this approach was reported by Salthouse (1993) in which relations of a composite WM measure, based on two complex span tasks, were examined across successive items in a prototypical Gf task, the Raven's Progressive Matrices test. Although some theoretical perspectives (e.g., Carpenter et al. 1990) would have predicted stronger WM relations on more difficult items, the WM–Gf correlations were nearly the same across problems varying in the number of relations among elements. Furthermore, the pattern of nearly constant relations of WM across Raven's items with different numbers of relational rules was later replicated by Unsworth and Engle (2005) and Wiley et al. (2011).
The WM-Gf relation was recently examined at the level of individual items in complex span WM tasks by Salthouse and Pink (2008). The major finding in that study was that the relations with cognitive abilities, especially Gf, were nearly constant across different set sizes in the span tasks and across successive trials. The authors concluded that “The small variation in the Gf–WM relations across set sizes suggest that the amount of required simultaneous storage and processing is not critical to the existence, or even much of the magnitude, of the relations between these tasks and other cognitive abilities. The finding that the initial trial in the WM tasks is nearly as informative as later trials with respect to individual differences in Gf also suggests that the relationship of WM variables with Gf apparently does not depend on processes that extend over successive trials, such as within-task learning or the accumulation of proactive interference (p. 369–370).”
These earlier studies indicate that relations at the level of individual items can be very informative in establishing boundary conditions for the WM-Gf relations. However, all of the prior studies assessed WM with complex span tasks, and a primary purpose of the current study was to investigate cognitive ability relations in running memory WM tasks. The tasks in this project were similar to the running memory task introduced by Pollack et al. (1959), and can be considered to assess WM because the participant is required to report only the most recent items in a list of unpredictable length, and thus he or she must repeatedly update the status of continuously changing information.
The running memory tasks in the current study involved the presentation of 4 to 12 items, with the participant instructed to report the last four items in the order in which they were presented. Parallel versions of the tasks with verbal (letters) and spatial (dot locations) stimuli were administered to examine the generalizability of the WM-Gf relations with material (spatial information) that may be less amenable to verbal rehearsal than the alphanumeric material often used in running memory tasks. With both types of material, longer lists were expected to be more difficult because more updating of the most recent four items was presumably required. Level of difficulty might also be expected to vary across different input positions if there was a recency benefit for the last input positions.
Many prior studies investigated WM-Gf relations with simple correlations, often involving a single Gf measure. However, there are at least two limitations of this approach. First, single variables seldom exclusively or exhaustively correspond to specific theoretical constructs because not only do they likely include influences from other theoretical constructs, test-specific factors and measurement error, but they typically only reflect a portion of the relevant construct. And second, when a single predictor construct is considered in the analyses all of the shared relations are attributed to that construct, whereas unique contributions of the construct can be determined if multiple constructs are included in the same analysis.
An analytical procedure termed contextual analysis (Salthouse, Pink & Tucker-Drob, 2008) addresses these concerns by representing each cognitive ability as a latent construct defined by the variance common to between three and four observed variables, and examining relations of several cognitive abilities to the target variable within a single analysis. The contextual analysis model is illustrated in Figure 1, with observed variables represented as rectangles and latent variables represented as circles. Note that four cognitive abilities, each represented as latent constructs, are simultaneous predictors of the target variable. The relations of greatest interest in this project are the paths indicated by the dotted lines because they indicate the unique influences of the cognitive abilities on the target variable after controlling influences associated with age and the other abilities. Because age is related both to the cognitive abilities and the target variable, influences of age are statistically controlled when analyzing relations between the abilities and the target variables.
Figure 1.

Contextual analysis model used in the analyses of the relations of cognitive abilities to running memory variables. The numbers in the arrows from age are standardized coefficients, and the numbers to the left of the variable names are the standardized loadings of the variables on the cognitive ability constructs.
To summarize, a sample of over 1,700 adults performed verbal and spatial running memory tasks, and also completed a battery of cognitive tests assessing different cognitive abilities. Relations of the cognitive abilities at the level of individual items in the running memory tasks were examined to determine whether the relations were stronger among items associated with the lowest levels of accuracy, or on the earliest trials in the task.
Methods
Participants
Characteristics of the sample, divided into four different age groups because of the wide age range, are presented in Table 1. As is typically found in cross-sectional samples, the older groups had higher levels of vocabulary performance, but lower composite scores for the other abilities.
Table 1.
Means (and standard deviations) of demographic characteristics and cognitive ability and running memory scores in four age groups
| Age Group | |||||
|---|---|---|---|---|---|
| 18–39 | 40–59 | 60–79 | 80–97 | Age r | |
| Number | 276 | 721 | 637 | 100 | NA |
| Age | 29.3 (5.5) | 51.4 (5.4) | 68.1 (5.4) | 83.8 (3.7) | NA |
| Proportion Female | .63 | .72 | .65 | .54 | −.04 |
| Self-Rated Health | 2.1 (.8) | 2.1 (.9) | 2.1 (.9) | 2.5 (.9) | .05 |
| Years of Education | 15.3 (2.7) | 15.6 (2.6) | 16.4 (2.7) | 16.5 (3.4) | .15* |
| Composite Cognitive Ability Scores | |||||
| Gf | .37 (.85) | .13 (.84) | −.13 (.73) | −.77 (.81) | −.31* |
| Memory | .27 (.79) | .13 (.79) | −.12 (.75) | −.91 (.75) | −.30* |
| Speed | .73 (.81) | .19 (.76) | −.36 (.71) | −1.12 (.63) | −.56* |
| Gc | −.47 (.84) | −.05 (.91) | .26 (.72) | .06 (.67) | .27* |
| Running Memory | |||||
| Letters | .60 (.22) | .55 (.20) | .49 (.20) | .37 (.19) | −.28* |
| Positions | .55 (.20) | .48 (.19) | .39 (.19) | .29 (.18) | −.35* |
p<.01
Analyses of the averages in the running memory tasks, but not item level results, have been described for subsets of this sample in prior reports (i.e., 236 participants in Study 2 of Salthouse et al., 2008; and 1056 adults in Salthouse, 2011).
Tasks
The 13 cognitive tests used to assess four cognitive abilities are briefly described in the appendix.
The running memory tasks in the current project were illustrated in Figure 3 of Salthouse (2011). With each type of stimuli the participants viewed lists of 4 to 12 items, and at the end of the list they were instructed to recall the last four items in the original order of presentation. That is, the most recently presented item was to be reported in the fourth position. The recall responses were made by using a mouse to click on the target item from an array of possible items. Each of the four items was scored separately, with a score of one if the identity was correct for that input position, and a score of zero if it was incorrect.
Two repeatable practice trials were administered before the experimental trials to ensure adequate understanding of the task. The order of the trials with different lengths varied randomly across participants with the constraint that the second trial with each list length was presented only after all of the list lengths had been presented once. The items within each trial were presented at a rate of one per second, with an unlimited time allowed to make the responses.
Results
The correlation between average accuracy in the running memory tasks with verbal and spatial information was .62. The verbal-spatial correlations were generally similar across list lengths (range of .38 to .43), input positions (.54 to .59), and successive trials (.18 to .40).
What factors affect running memory performance?
Accuracy in each task was analyzed with list length, input position and age (the four age groups described in Table 1) as factors in a mixed analysis of variance (ANOVA). Results of these analyses are reported in Table 2, where it can be seen that there were large main effects of age group, list length, and input position, but no evidence of interactions involving age.
Table 2.
Analysis of variance results on accuracy with age group, list length, and input position as factors.
| df | F Value | partial η2 | |
|---|---|---|---|
| Letters | |||
| Age Group | 1, 3 | 36.72* | .066 |
| List Length | 8, 1557 | 52.68* | .033 |
| Age × List Length | 24, 4677 | 0.42 | .001 |
| Input Position | 3, 1562 | 859.61* | .355 |
| Age × Position | 9, 4692 | 1.57 | .003 |
| List Length × Position | 24, 1541 | 41.15* | .026 |
| Age × List × Position | 72, 4629 | 1.35 | .003 |
| List Length | |||
| @ Position 1 | 101.58* | .061 | |
| @ Position 2 | 41.57* | .026 | |
| @ Position 3 | 30.90* | .019 | |
| @ Position 4 | 6.07* | .004 | |
| Positions | |||
| Age Group | 1, 3 | 68.30* | .113 |
| List Length | 8, 1600 | 79.20* | .047 |
| Age × List Length | 24, 4806 | 1.55 | .003 |
| Input Position | 3, 1605 | 1064.32* | .398 |
| Age × Position | 9, 4821 | 7.21* | .013 |
| List Length × Position | 24, 1584 | 76.90* | .046 |
| Age × List × Position | 72, 4758 | 1.87 | .003 |
| List Length | |||
| @ Position 1 | 384.48* | .193 | |
| @ Position 2 | 157.09* | .089 | |
| @ Position 3 | 77.38* | .046 | |
| @ Position 4 | 35.49* | .022 |
Note:
p<.01
Because the list length \m=x\ input position interaction was significant, effects of list length were examined separately at each position. The results in the bottom portions of each panel in Table 2 indicate that the list length effects were smaller on later input positions (i.e., recency items).
Figure 2 portrays accuracy at different recall positions as a function of list length. Notice that there was little effect of list length on the last recall position, but progressively larger effects of list length on accuracy in the third, second, and first input positions.
Figure 2.
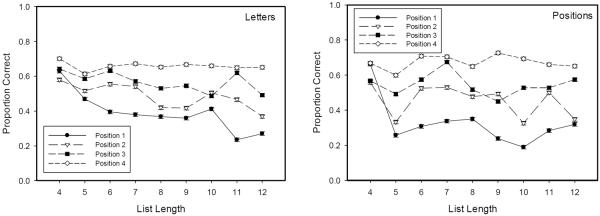
Mean proportion correct, with standard errors, for accuracy in different input positions as a function of list length in the running memory tasks with letter and position stimuli.
Because much of the research on WM-Gf relations has been conducted with participants from a very restricted age range, the analyses were repeated in a subset of 276 adults between 18 and 39 years of age. Results of these analyses were very similar to those in Table 2. To illustrate, the effect sizes (partial eta squared) for letters and positions were, respectively, .053 and .070 for the list length effects, .544 and .632 for the input position effects, and .052 and .075 for the list length \m=x\ input position interactions.
Another set of analyses examined variation in accuracy across successive trials. The proportion correct values across the 18 trials ranged from .50 to .58 for letters and from .48 to .54 for positions. Although there were significant differences across trials with both types of material (i.e., F ratios of 9.95 for letters and 4.45 for positions), the effects were small and are at least partly attributable to the large degrees of freedom (i.e., over 1,500). Effect sizes (partial eta squared) for the total effects and for the linear, quadratic, and cubic trends were, respectively, .006, .040, .006, and .015 for letters, and .003, .002, .012, and .003 for positions.
Relations with cognitive abilities
Contextual analyses were performed with the model portrayed in Figure 1. The analyses were conducted with the AMOS (Arbuckle, 2007) structural equation modeling program with the full information maximum likelihood algorithm to deal with missing data. The model in Figure 1 without a target variable had only a modest fit (i.e., X2 = 1133, df = 68, CFI = .92, and RMSEA = .10). The fit could be improved (i.e., X2 = 633, df = 65, CFI = .96, and RMSEA = .07) by adding correlated residuals among tests with parallel formats (e.g., pattern comparison and letter comparison), and allowing more than one ability to influence a test (e.g., relations from vocabulary to Shipley abstraction). Although these modifications improved the overall fit, they had little effect on the definition of the latent constructs, and because the pattern of relations with the target variables was similar in this model and in the simpler model, only results with the simpler model are reported.
Table 3 reports results of the contextual analyses, in the form of standardized regression coefficients, on the average scores, and separately by list length, input position, and trial number. The column labeled total age relation contains the simple correlation between age and the target variable determined in separate analyses, and the column labeled unique age relation contains the influence of age (i.e., standardized coefficient) on the target variable after controlling influences through the cognitive abilities. The much smaller unique than total age relations implies that there would have been little or no age differences in the running memory measures if there had been no individual differences in the reference cognitive abilities.
Table 3.
Contextual analysis results (standardized regression coefficients) on average performance and performance in different list lengths, input positions, and successive trials
| Age | ||||||
|---|---|---|---|---|---|---|
| Total | Unique | Gf | Memory | Speed | Gc | |
| Letter Stimuli | ||||||
| Average | −.28* | −.06 | .62* | .05 | −.01 | .00 |
| List 4 | −.18* | −.01 | .49* | −.02 | −.01 | −.03 |
| List 5 | −.22* | −.02 | .49* | .01 | .01 | .01 |
| List 6 | −.17* | .05 | .47* | .07 | .05 | −.05 |
| List 7 | −.21* | −.09 | .25* | .10 | .04 | .09 |
| List 8 | −.23* | −.06 | .41* | .03 | −.04 | −.03 |
| List 9 | −.22* | −.12* | .40* | −.02 | .00 | .10 |
| List 10 | −.20* | −.05 | .45* | −.01 | −.01 | −.01 |
| List 11 | −.19* | −.05 | .48* | .03 | −.10 | −.03 |
| List 12 | −.22* | −.05 | .58* | −.03 | −.05 | −.04 |
| Position 1 | −.25* | −.01 | .51* | .11 | .06 | −.06 |
| Position 2 | −.28* | −.05 | .56* | .04 | .00 | −.00 |
| Position 3 | −.26* | −.07 | .62* | .04 | −.04 | .01 |
| Position 4 | −.24* | −.07 | .58* | .05 | −.05 | .04 |
| Trial 1 | −.19* | −.04 | .46* | −.03 | −.02 | −.03 |
| Trial 2 | −.21* | −.13* | .36* | −.01 | −.05 | .06 |
| Trial 3 | −.17* | −.05 | .41* | .06 | −.06 | .04 |
| Trial 4 | −.22* | −.06 | .39* | .01 | −.01 | −.04 |
| Trial 5 | −.15* | −.02 | .40* | .01 | −.02 | .02 |
| Trial 6 | −.18* | −.02 | .37* | .01 | −.01 | −.06 |
| Trial 7 | −.18* | −.01 | .34* | .04 | .02 | −.02 |
| Trial 8 | −.13* | .04 | .31* | .14 | .02 | −.03 |
| Trial 9 | −.18* | −.05 | .36* | .02 | −.00 | .01 |
| Trial 10 | −.15* | .02 | .41* | −.10 | .03 | −.03 |
| Trial 11 | −.17* | .00 | .37* | −.05 | .01 | −.01 |
| Trial 12 | −.16* | −.04 | .31* | .08 | −.03 | −.01 |
| Trial 13 | −.17* | −.05 | .36* | .04 | −.04 | .00 |
| Trial 14 | −.12* | .01 | .30* | .06 | .04 | .05 |
| Trial 15 | −.14* | .05 | .46* | .02 | −.02 | −.09 |
| Trial 16 | −.13* | .04 | .27* | .09 | .07 | .00 |
| Trial 17 | −.18* | −.07 | .30* | .02 | .02 | .05 |
| Trial 18 | −.18* | .00 | .42* | .02 | −.02 | −.04 |
| Position Stimuli | ||||||
| Average | −.35* | .02 | .77* | .08 | .01 | −.23* |
| List 4 | −.22* | .11* | .60* | .08 | .05 | −.24* |
| List 5 | −.33* | −.08 | .64* | .01 | −.02 | −.13 |
| List 6 | −.29* | .05 | .63* | .07 | .06 | −.22* |
| List 7 | −.25* | .05 | .64* | .07 | −.02 | −.21* |
| List 8 | −.30* | .03 | .62* | .08 | .03 | −.19* |
| List 9 | −.28* | .01 | .61* | .04 | .02 | −.15* |
| List 10 | −.30* | −.07 | .58* | .04 | −.04 | −.12 |
| List 11 | −.26* | .04 | .60* | .12 | .01 | −.16* |
| List 12 | −.32* | −.09 | .56* | .05 | −.05 | −.16* |
| Position 1 | −.34* | .02 | .66* | .09 | .03 | −.27* |
| Position 2 | −.34* | .02 | .74* | .01 | .01 | −.24* |
| Position 3 | −.33* | .02 | .80* | .01 | −.01 | −.21* |
| Position 4 | −.29* | .02 | .63* | .09 | .03 | −.15* |
| Trial 1 | −.23* | −.04 | .51* | .01 | −.01 | −.07 |
| Trial 2 | −.23* | −.02 | .38* | .05 | .05 | −.09 |
| Trial 3 | −.20* | .02 | .43* | .01 | .08 | −.09 |
| Trial 4 | −.17* | .07 | .54* | .00 | .02 | −.15* |
| Trial 5 | −.27* | −.02 | .47* | .12 | −.02 | −.22* |
| Trial 6 | −.20* | .03 | .56* | .03 | −.03 | −.16* |
| Trial 7 | −.23* | .04 | .52* | .01 | .05 | −.18* |
| Trial 8 | −.20* | .08 | .52* | .09 | .02 | −.20* |
| Trial 9 | −.23* | −.01 | .43* | .05 | .04 | −.11 |
| Trial 10 | −.24* | −.04 | .39* | .08 | .01 | −.11 |
| Trial 11 | −.24* | −.03 | .58* | −.02 | −.04 | −.13 |
| Trial 12 | −.24* | −.02 | .42* | .00 | −.00 | −.14* |
| Trial 13 | −.24* | −.02 | .47* | .13 | −.05 | −.17* |
| Trial 14 | −.23* | .04 | .48* | .10 | .04 | −.17* |
| Trial 15 | −.22* | −.02 | .42* | .06 | −.06 | −.13 |
| Trial 16 | −.26* | −.08 | .43* | .00 | −.00 | −.08 |
| Trial 17 | −.26* | .02 | .51* | .12 | −.01 | −.22* |
| Trial 18 | −.21* | .03 | .49* | .02 | .10 | −.10 |
p<.01
The values in the remaining columns of Table 3 contain the standardized coefficients for the relations between the cognitive ability constructs and the target variable (specified in the row) after controlling influences of age and the other cognitive abilities. It can be seen that only the Gf cognitive ability was significantly related to performance in the letter running memory task, but that there was also a negative relation of Gc ability on performance in the position running memory task. Of greatest importance in the current report were the nearly constant relations in Table 3 across different list lengths, input positions, and trials. That is, the influences of the cognitive abilities on accuracy with lists of four items, when the task was to report all presented items, were nearly the same as on longer lists when between one and eight updating operations were presumably required, and the relations on input position 4, which had a much higher level of accuracy than the earlier input positions, were very similar to those on positions 1 through 3. The relations were also approximately constant across successive trials, with nearly the same pattern on the first experimental trial as on the last trial.
Discussion
Analyses at the level of individual items revealed systematic differences in accuracy as a function of list length and input position, and an interaction in the direction of weaker list length effects in recall of the last input position. The lack of list length effects on later positions may be attributable to a recency advantage for the last one or two items. Accuracy was lower at earlier input positions for lists with five or more items, but there was not much systematic variation in accuracy with these positions for lists between 6 and 12 items.
Because task difficulty clearly varied across list length and input position, it is meaningful to determine whether the different accuracy levels were associated with variations in the strengths of relations with Gf or other cognitive abilities. The major findings from the contextual analyses in Table 3 were that the relations were no stronger on longer lists, or on earlier input positions. These results suggest that whatever is contributing to the relations of cognitive abilities in the current running memory tasks is independent of the presumed number of updating operations (as reflected by list length), and of the input position of the target item.
The very small effects of trial number on accuracy imply that sequential effects such as learning, or the accumulation of proactive interference, were probably not important determinants of performance in these tasks. Furthermore, the contextual analysis results revealed a similar pattern of influences across all trials, and there was no evidence of stronger (or weaker) influences on later trials. Whatever is contributing to the relation between running memory tasks and other cognitive abilities is therefore apparent on the very first experience with running memory trials.
It has been proposed that running memory tasks might be performed with passive registration followed by active rehearsal (e.g., Broadway & Engle, 2010; Bunting et al. 2006). Although a strategy such as this is possible, the similar patterns with verbal and spatial stimuli suggest that verbal rehearsal probably plays a minor role in the current results because rehearsal is less likely with spatial information. Regardless of the manner in which the task is performed, however, it is important to note that the relations with Gf and other abilities were nearly constant across successive trials, list lengths, and input positions.
How can the lack of differential relations with cognitive abilities across individual items be explained? That is, why were there not stronger relations with cognitive abilities when the conditions are more demanding because more updating was required or there was less reliance on recency, and across all trials? Salthouse and Pink (2008) suggested that nearly constant Gf relations with complex span tasks may “reflect an ability of people with high levels of Gf to adapt quickly to a new task and perform effectively, even in situations that have minimal demands for simultaneous storage and processing (p. 370).” It is therefore possible that it is novelty and complexity that contributes to relations with Gf, and that there may not be anything special about either complex span or updating WM tasks with respect to these properties. This suggestion is similar to the proposal by Oberaurer, Sus, Wilhelm and Wittmann (2008) that WM and Gf tasks are related not necessarily because of the requirement of simultaneous storage and processing, but rather because both involve the ability to form new structural representations. Widaman (2011) recently expressed an opinion similar to the current perspective in the following passage:
“Many recent studies of working memory have touted working memory as a key component of fluid intelligence. But, working memory measures do not provide scores on cognitive processes; instead, working memory measures are complex psychometric tasks. Rather than working memory being a component of fluid intelligence, a reasonable view is that fluid intelligence is a major component of successful performance on working memory tasks … (p. 494).”
An implication of the hypothesis that Gf may be more comprehensive than WM is that Gf relations would be expected across many different types of tasks, even those with little resemblance to WM, and several results of this type were recently reported by Salthouse et al. (2008) with a variety of tasks postulated to assess aspects of executive functioning and mental control. This interpretation also implies that if Gf and WM are considered as simultaneous predictors of the target variable, there should be unique prediction of a target variable from Gf but little unique prediction from WM, and patterns such as this were recently reported in Salthouse (2011).
Item-level analyses such as those reported in this study could be informative in investigating a variety of interpretations of the determinants of Gf. For example, several authors have suggested that measures of simple storage as measured in short-term memory tasks can explain much of the variance in Gf (e.g., Chuderski et al., 2012; Martinez et al., 2011). If storage is a key factor contributing to variance in Gf, the relations of span tasks with Gf should vary as a function of amount of storage and be greatest on trials with the largest storage demands, whereas if the current novel processing interpretation is correct, the span-Gf relations would be expected to be nearly the same on the earliest and easiest trials as on trials involving more storage.
In conclusion, WM is closely related to Gf, and it is sometimes postulated to be the core component responsible for individual differences in Gf. A fundamental implication of this view is that the strength of the WM-Gf relation should be modulated according to the WM demands in the tasks. Because an accumulating body of results indicate that the WM-Gf relations are nearly constant across different levels of difficulty in each task, and across successive trials in either type of task, an alternative interpretation of the WM-Gf relation worth considering is that one aspect of Gf is the ability to deal with novelty and complexity, and WM tasks are typically high in both novelty and complexity.
Highlights
-
-
Moderately strong relations between measures of working memory and fluid intelligence are well documented, but there is not yet a consensus regarding the reasons for the relations
-
-
Most prior analyses have examined relations between global or summary measures of working memory or fluid intelligence
-
-
When the sample size is sufficiently large the relations can be examined at the level of individual items to determine if the relations are stronger when the tasks are more demanding
-
-
Analyses revealed nearly constant relations of fluid intelligence and other cognitive abilities across running memory items varying in difficulty and successive trials in the task
-
-
These results are consistent with the interpretation that the relation between working memory and fluid intelligence may be attributable to the novel and complex nature of working memory tasks
Acknowledgments
This research was supported by Award Number R37AG024270 from the National Institute on Aging. The content is solely the responsibility of the author and does not necessarily represent the official views of the National Institute on Aging or the National Institutes of Health.
Appendix.
Description of reference variables and sources of tasks
| Variable | Description | Source |
|---|---|---|
| WAIS Vocabulary | Provide definitions of words | Wechsler (1997a) |
| Picture Vocabulary | Name the pictured object | Woodcock & Johnson (1990) |
| Antonym Vocabulary | Select the best antonym of the target word | Salthouse (1993b) |
| Synonym Vocabulary | Select the best synonym of the target word | Salthouse (1993b) |
| Matrix Reasoning | Determine which pattern best completes the missing cell in a matrix |
Raven (1962) |
| Shipley Abstraction | Determine the words or numbers that are the best continuation of a sequence |
Zachary (1986) |
| Letter Sets | Identify which of five groups of letters is different from the others |
Ekstrom, et al., (1976) |
| Logical Memory | Number of idea units recalled across three stories |
Wechsler (1997b) |
| Free Recall | Number of words recalled across trials 1 to 4 of a word list |
Wechsler (1997b) |
| Paired Associates | Number of response terms recalled when presented with a stimulus term |
Salthouse, et al. (1996) |
| Digit Symbol | Use a code table to write the correct symbol below each digit |
Wechsler (1997a) |
| Letter Comparison | Same/different comparison of pairs of letter strings |
Salthouse & Babcock (1991) |
| Pattern Comparison | Same/different comparison of pairs of line patterns |
Salthouse & Babcock (1991) |
Footnotes
Publisher's Disclaimer: This is a PDF file of an unedited manuscript that has been accepted for publication. As a service to our customers we are providing this early version of the manuscript. The manuscript will undergo copyediting, typesetting, and review of the resulting proof before it is published in its final citable form. Please note that during the production process errors may be discovered which could affect the content, and all legal disclaimers that apply to the journal pertain.
The ambiguity with respect to the direction of the relation is evident in the following quotation: “A person's ability to reason with novel information can be largely attributed to WM capacity, and vice versa (Shipstead et al., 2012, p. 630). (Italics added).
There are no conflicts of interest.
References
- Ackerman PL, Beier ME, Boyle MO. Working memory and intelligence: The same or different constructs? Psychological Bulletin. 2005;131:30–60. doi: 10.1037/0033-2909.131.1.30. [DOI] [PubMed] [Google Scholar]
- Arbuckle JL. AMOS (Version 7) SPSS; Chicago: 2007. Computer Program. [Google Scholar]
- Broadway JM, Engle RW. Validating running memory span: Measurement of working memory capacity and links with fluid intelligence. Behavior Research Methods. 2010;42:563–570. doi: 10.3758/BRM.42.2.563. [DOI] [PubMed] [Google Scholar]
- Bunting M, Cowan N, Saults JS. How does running memory span work? The Quarterly Journal of Experimental Psychology. 2006;59:1691–1700. doi: 10.1080/17470210600848402. [DOI] [PMC free article] [PubMed] [Google Scholar]
- Carpenter PA, Just M, Shell P. What one intelligence test measures: A theoretical account of the processing in the Raven Progressive Matrices Test. Psychological Review. 1990;97:404–431. [PubMed] [Google Scholar]
- Chuderski A, Taraday M, Necka E, Smolen T. Storage capacity explains fluid intelligence but executive control does not. Intelligence. 2012;40:278–295. [Google Scholar]
- Ekstrom RB, French JW, Harman HH, Dermen D. Manual for kit of factor-referenced cognitive tests. Educational Testing Service; Princeton, NJ: 1976. [Google Scholar]
- Kane MJ, Hambrick DZ, Conway ARA. Working memory capacity and fluid intelligence are strongly related constructs: Comment on Ackerman, Beier, and Boyle (2005) Psychological Bulletin. 2005;131:66–71. doi: 10.1037/0033-2909.131.1.66. [DOI] [PubMed] [Google Scholar]
- Martinez K, Burgaleta M, Roman FJ, Escorial S, Shih PC, Quiroga MA, Bolom R. Can fluid intelligence be reduced to `simple' short-term storage? Intelligence. 2011;39:473–480. [Google Scholar]
- Oberaurer K, Schulze R, Wilhelm O, Sus H-M. Working memory and intelligence – their correlation and their relation: Comment on Ackerman, Beier, and Boyle (2005) Psychological Bulletin. 2005;131:61–65. doi: 10.1037/0033-2909.131.1.61. [DOI] [PubMed] [Google Scholar]
- Oberaurer K, Sus H-M, Wilhelm O, Wittmann WW. Which working memory functions predict intelligence? Intelligence. 2008;36:641–652. [Google Scholar]
- Pollack I, Johnson LB, Knaff PR. Running memory span. Journal of Experimental Psychology. 1959;57:137–146. doi: 10.1037/h0046137. [DOI] [PubMed] [Google Scholar]
- Raven J. Advanced Progressive Matrices, Set II. H.K. Lewis; London: 1962. [Google Scholar]
- Salthouse TA. Influence of working memory on adult age differences in matrix reasoning. British Journal of Psychology. 1993a;84:171–199. doi: 10.1111/j.2044-8295.1993.tb02472.x. [DOI] [PubMed] [Google Scholar]
- Salthouse TA. Speed and knowledge as determinants of adult age differences in verbal tasks. Journal of Gerontology: Psychological Sciences. 1993b;48:P29–P36. doi: 10.1093/geronj/48.1.p29. [DOI] [PubMed] [Google Scholar]
- Salthouse TA. What cognitive abilities are involved in trail-making performance? Intelligence. 2011;39:222–232. doi: 10.1016/j.intell.2011.03.001. [DOI] [PMC free article] [PubMed] [Google Scholar]
- Salthouse TA, Babcock RL. Decomposing adult age differences in working memory. Developmental Psychology. 1991;27:763–776. [Google Scholar]
- Salthouse TA, Fristoe N, Rhee SH. How localized are age-related effects on neuropsychological measures? Neuropsychology. 1996;10:272–285. [Google Scholar]
- Salthouse TA, Pink JE. Why is working memory related to fluid intelligence? Psychonomic Bulletin & Review. 2008;15:364–371. doi: 10.3758/PBR.15.2.364. [DOI] [PMC free article] [PubMed] [Google Scholar]
- Salthouse TA, Pink JE, Tucker-Drob EM. Contextual analysis of fluid intelligence. Intelligence. 2008;36:464–486. doi: 10.1016/j.intell.2007.10.003. [DOI] [PMC free article] [PubMed] [Google Scholar]
- Shipstead Z, Redick TS, Engle RW. Is working memory training effective. Psychological Bulletin. 2012;138:628–654. doi: 10.1037/a0027473. [DOI] [PubMed] [Google Scholar]
- Unsworth N, Engle RW. Working memory capacity and fluid abilities: Examining the correlation between Operation Span and Raven. Intelligence. 2005;33:67–81. [Google Scholar]
- Wechsler D. Wechsler Adult Intelligence Scale: Third edition. Psychological Corporation; San Antonio, TX: 1997a. [Google Scholar]
- Wechsler D. Wechsler Memory Scale: Third edition. Psychological Corporation; San Antonio, TX: 1997b. [Google Scholar]
- Widaman KF. A cognitive psychologist's take on intelligence, more or less (more and less?): Review of Earl Hunt (2011) Human Intelligence. Intelligence. 2011;39:493–496. [Google Scholar]
- Wiley J, Jarosz AF, Cushen PJ, Colflesh GJH. New rule use drives the relation between working memory capacity and Raven's Advanced Progressive Matrices. Journal of Experimental Psychology: Learning, Memory, and Cognition. 2011;37:256–263. doi: 10.1037/a0021613. [DOI] [PubMed] [Google Scholar]
- Woodcock RW, Mather N. Standard and Supplemental Batteries: Examiner's Manual. DLM; Allen, TX: 1990. Woodcock-Johnson Tests of Cognitive Ability. [Google Scholar]
- Zachary RA. Shipley Institute of Living Scale - Revised. Western Psychological Services; Los Angeles, CA: 1986. [Google Scholar]