
Figure 2. DCX undergoes a cooperative transition in microtubule binding.
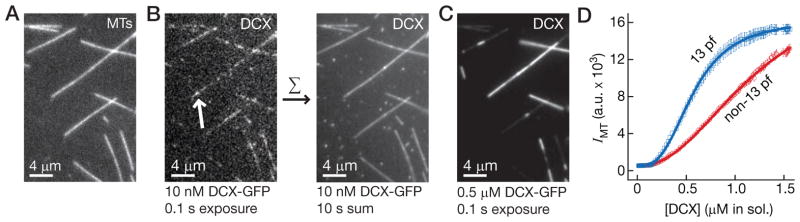
(A) Image of a mixed population of rhodamine-labeled microtubules. (B) Left, Image of 10 nM DCX-GFP exposed to a mixed population of microtubules taken with a 0.1 s camera exposure. Single DCX-GFP molecules were observed as diffraction-limited signals (white arrow). Right, Image of a 10 s summation (100 × 0.1 s frames) of DCX-GFP. No preference for 13-pf microtubules could be measured. (C) Image of 0.5 μM DCX-GFP exposed to the same microtubules as in (A), taken with a 0.1 s camera exposure. A clear preference for 13-pf microtubules is evident. (D) Plot of DCX-GFP intensity on the microtubules against the protein concentration in solution during titration of DCX-GFP into the microscope chamber. The bright, 13-pf microtubules (blue squares) were distinguished from the dimmer, non-13-pf microtubules (red circles). Error bars represent the SEM (n = 10). For curve-fitting, the data were fitted to the Hill equation, y = y0 + (ymax − y0) · xnH=(KnH + xnH) (lines plotted). See also Figure S2.