
Figure 6. Model schematic for the mechanism of DCX.
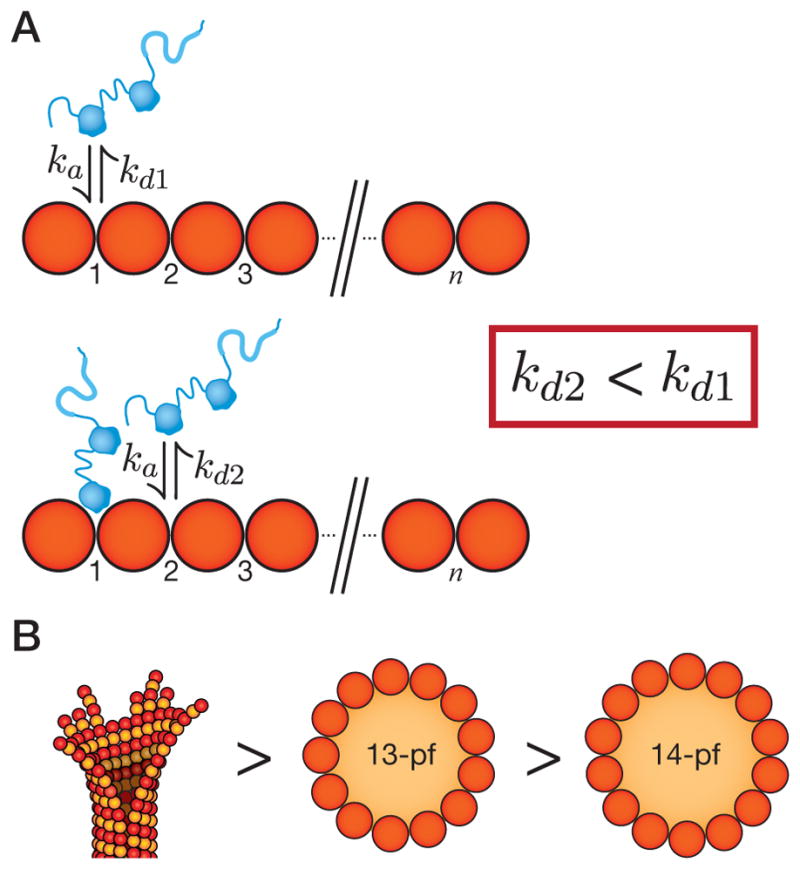
(A) The microtubule is depicted as an array of binding sites (numbered). DCX binds to microtubules in the groove between protofilaments, at the vertex of four tubulin dimers. In the absence of nearby molecules (top), DCX associates with an association rate constant, ka and dissociates with a dissociation rate constant, kd1. In the presence of nearby molecules (bottom), the dissociation rate constant falls (kd2 < kd1). (B) The affinity of DCX for microtubules is highest for microtubule end structures (left), intermediate for the 13-pf microtubule lattice (center), and lower for the 14-pf microtubule lattice (right).