
Figure 5. PD184352 synergizes with nilotinib to induce synthetic lethality in cells expressing BCR-ABLT315I in vitro.
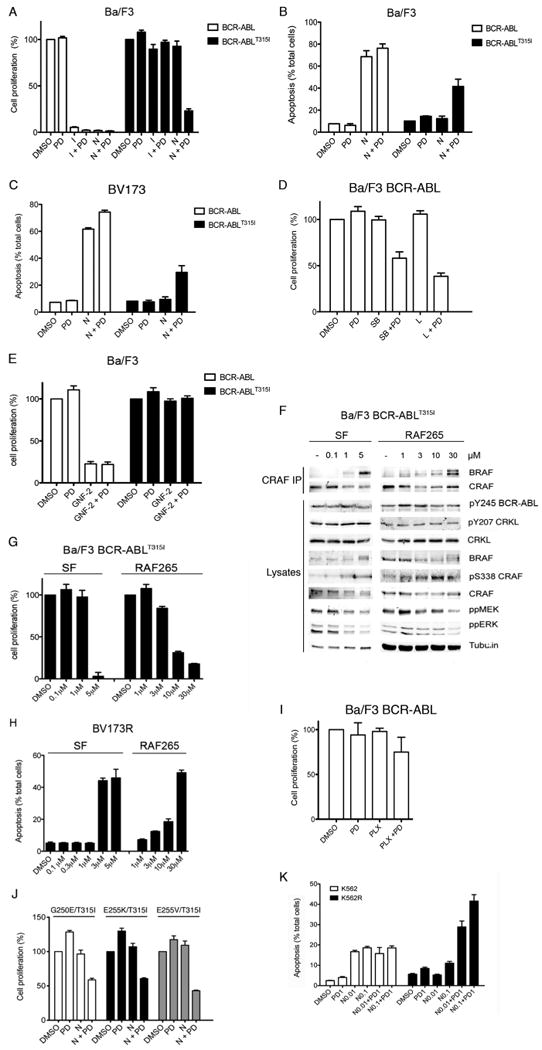
A. Cell proliferation was measured in BCR-ABL and BCR-ABLT315I Ba/F3 cells treated with DMSO, PD184352 (PD; 2μM), imatinib (I; 3μM), nilotinib (N; 1μM) or the indicated combinations for 4 days. Growth, determined in triplicate, is expressed as a percentage of the DMSO controls with error bars to represent SD from the mean.
B. Percentage of apoptotic cells in BCR-ABL and BCR-ABLT315I Ba/F3 cells treated with DMSO, PD184352 (PD; 2μM), nilotinib (N; 1μM) or the indicated combinations for 4 days. Apoptosis was detected by staining cells with annexin V and propidium iodide. The mean percentage of apoptotic cells is shown, as determined by triplicate samples, along with the SD.
C. Percentage of apoptosis in BV173 and BV173R cells treated with DMSO, PD184352 (PD; 0.2μM), nilotinib (N; 0.1μM) or the indicated combinations for 6 days. The cells were fixed and stained with propidium iodide and sub-G1 cells were measured by flow cytometry. The mean of triplicate samples is shown with the SD.
D. Cell proliferation was measured in BCR-ABL Ba/F3 cells treated with PD184352 (PD; 2μM), SB590885 (SB; 0.3μM), L779450 (L; 0.3μM), or the indicated combinations for 72 hr. Cell growth determinations in triplicate are expressed relative to the DMSO control along with the SD.
E. Cell proliferation was measured in BCR-ABL and BCR-ABLT315I Ba/F3 cells treated with PD184352 (PD; 2μM), GNF-2 (1μM), or the indicated combination for 4 days. Cell growth determinations in triplicate are expressed relative to the DMSO control along with the SD.
F. Western blots for endogenous BRAF, CRAF, pY245 BCR-ABL, pY207 CRKL, CRKL, pS338 CRAF, ppMEK and ppERK and tubulin (loading control) in CRAF immunoprecipitates (CRAF IP) and cell lysates from BCR-ABLT315I Ba/F3 cells treated with the indicated concentrations of sorafenib (SF) and RAF265.
G. Cell proliferation was measured in BCR-ABLT315I Ba/F3 cells treated with the indicated concentrations of sorafenib (SF) and RAF265 for 72 hr. Growth, determined in triplicate, is expressed as a percentage of the DMSO controls with the SD.
H. Percentage of apoptotic BV173R cells treated with the indicated concentrations of sorafenib (SF) and RAF265 for 72 hr. Cells were fixed and stained with propidium iodide and sub-G1 cells were measured by flow cytometry. The mean of triplicate samples is shown with the SD.
I. Cell proliferation was measured in BCR-ABL Ba/F3 cells treated with PD184352 (PD; 2μM), PLX4720 (PLX; 1μM) or the indicated combinations for 72 hr. Growth, determined in triplicate, is expressed as a percentage of the DMSO controls and error bars represent SD.
J. Cell proliferation was measured in BCR-ABLG250E/T315I, BCR-ABLE255K/T315I and BCR-ABLE255V/T315I Ba/F3 cells treated with DMSO, PD184352 (PD; 2μM), nilotinib (N; 1μM) or the indicated combinations for 4 days. Growth, determined in triplicate, is expressed as a percentage of the DMSO controls and error bars represent SD.
K. Percentage of apoptotic K562 and K562R cells treated with PD184352 (PD; 1μM), the indicated concentrations of nilotinib (N) or combinations of both for 4 days. The cells were fixed and stained with propidium iodide and sub-G1 cells were measured by flow cytometry. The mean percentage of apoptotic cells is shown, as determined by triplicate samples, along with the SD.