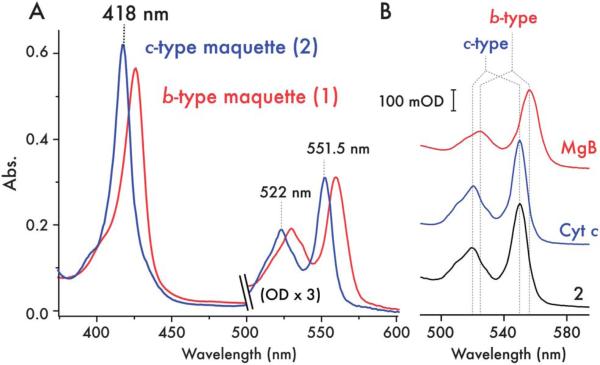
Fig. 2.
Spectroscopic characterization of the c-type cytochrome maquette. (A) UV/visible spectra of ferrous 1 with bound heme B (red) and purified 2 with covalently incorporated heme C (blue) reveals the expected blue-shift in the absorption spectrum of the c-type heme. (B) UV/visible spectra of the pyridine hemochrome (α/β region) preparations of horse heart myoglobin (red, MgB), bovine cytochrome c (blue, Cyt c) and 2 (black). Stereotypical peak positions for b-type heme and c-type heme are indicated by dashed lines, highlighting the spectroscopic fingerprint for c-type heme in 2.

